Excess Deaths in Puerto Rico from Hurricane Maria:
Reviewing the Milken Study
Steven Kopits / steven.kopits@princetonpolicy.com
In late August, the Milken Institute of Public Health at George Washington University released its long-awaited study, Ascertaining the Estimated Excess Mortality from Hurricane María in Puerto Rico (the Milken Study). As did the Harvard-led Mortality in Puerto Rico after Hurricane Maria (MPR) study, the Milken Institute tallied the excess deaths which could be attributed to Hurricane Maria.
We had earlier been sharply critical of the Harvard-led MPR study as materially misleading in terms of excess deaths following the storm. We assess the Milken Study similarly to provide an independent review of this politicized topic.
We conclude that Milken’s year-end estimate of 2,098 excess deaths is supportable given certain plausible assumptions. Our own calculation for this period yields 1,439 excess deaths as we believe that fewer people left the island and those who left were younger than does Milken. Further, unlike Milken, we believe deaths were rising on the island due to PROMESA austerity, and therefore our expectations of baseline deaths were higher, and excess deaths from the hurricane were thus correspondingly lower.
Unlike Milken, we are unable to identify any excess deaths on the island in January-February of this year, and thus believe Milken’s Sept. 2017 – Feb. 2018 excess death count is twice that of a more plausible estimate.

Deaths
Deaths in Puerto Rico tell a curious story. From 2010 to 2015, deaths were falling at a pace of about 175 per year. That trend turned around, however, in 2015. Since then, deaths have been rising at the pace of about 1300 per year. Which trend should we use for establishing baseline expectations?
We believe the more recent trend is more compelling. Why? Because Puerto Rico hit a fiscal wall when it defaulted on its loans in 2015. This upended public services on the island. Indeed, the Obama administration in October of that year urged Congress to devise a plan for Puerto Rico's massive debt in order to avoid a humanitarian crisis. The subsequent mortality numbers give an idea of what a humanitarian crisis might look like. For example, deaths in the first eight months of 2017 alone – before the hurricane – were 570 above the 2015 trough.

Source: Government of Puerto Rico, Milken Study, Princeton Policy analysis
Thus, the numbers suggest that the excess deaths did not begin in Puerto Rico after the hurricane, but in fact two years earlier. Cuts in spending were implemented from 2016 at the behest of the Federal government’s Fiscal Control Board, which oversees fiscal matters in Puerto Rico under bankruptcy. To all appearances, cuts in healthcare budgets led to markedly increased mortality.
If we thus use the post-bankruptcy 2015-2017 linear trend as the basis for our expectations and project the first eight months of 2017 onto the balance of the year, then we would have expected 29,939 deaths for the year as a whole barring Hurricane Maria. As it was, deaths came in at 30,917, representing 1,218 excess deaths for 2017 as a whole (after adjusting for an undershoot in the first eight months of the year).
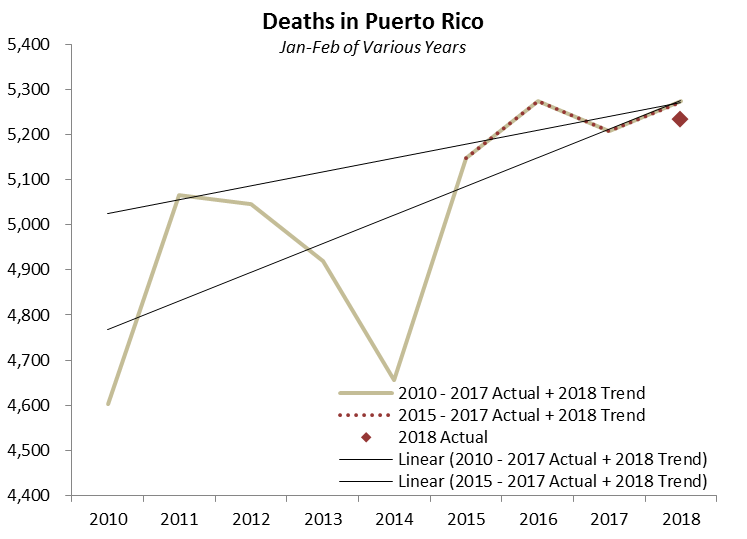
By contrast, if we look at the Jan.-Feb. 2018 period, excess deaths are hard to find. A linear regression based on either the 2010-2017 or the 2015-2017 actuals yields essentially the same number of expected deaths, around 5,272 for the two month period. The observed number of deaths totaled 5,233, about 39 less than expected. It is hard to conceive of an approach which would reach a much higher number of excess deaths for this particular period.
Source: Government of Puerto Rico, Milken
Thus, before counting those who left the island, we calculate the number of excess deaths for the Sept. – Dec. 2017 period at 1,218, and 1,179 for the full Sept. 2017 – Feb. 2018 period.
Deaths adjusted for Puerto Ricans fleeing the hurricane
Milken argues that mortality needs to be adjusted for those who left the island but would have died had they remained. This is a bit like counting those who escaped a burning building as having died from a statistical point of view, but it is not entirely without merit in attributing deaths to the hurricane.
How many people left the island due to the hurricane? Air departures provide a good metric.
Puerto Rico lies 1,000 miles southeast of Florida. As a practical matter, people enter and leave the island by air. A ticket for the two-and-a-half hour flight from San Juan to Miami can be purchased for a mere $132 one way on Jet Blue (albeit the ticket was vastly more expensive in the immediate aftermath of the hurricane). The alternative would be departure by boat, which would be highly impractical for any at-risk person, for example, one with a heart condition or requiring dialysis. Therefore, we can anticipate that virtually all those Puerto Ricans fleeing from the hurricane did so on commercial airlines, primarily to the US.
The number of net departures from Puerto Rico is readily available from Bureau of Transportation Statistics data. Departures have exceeded arrivals on the island for many years. Before Puerto Rico’s financial crisis, about 45,000 people emigrated annually. From 2014, net departures jumped to 84,000 per year. Interestingly, net departures in 2017 before the hurricane had fallen back to levels more typical for the island.
As Milken contends, the data does indeed show an abnormal exodus from the island. For 2017 as a whole, 281,000 people left the island. This trend reversed in early 2018, with about 75,000 returning through February.

Source: Bureau of Transportation Statistics for San Juan, Aguadilla, and Ponce Airports.
For our purposes, we are concerned with those who left directly as a result of the hurricane, as that relates to the counter-factual. By early September last year, hurricanes Harvey and Irma had already pounded Houston and Florida respectively. Those who left the Puerto Rico in early September may have done so in anticipation of a similar blow to the island. Therefore, departures due to Maria are reasonably estimated to start from the beginning of September.
On the graph below, we can see cumulative net departures from September. These peaked at 212,000 in December, before reversing early in 2018 and settling at 130,000 at the end of February. Of course, the counter-factual involves an adjustment for those who would have traveled even without a storm. To make this adjustment, we can use either the previous year or the previous decade average, which yield essentially similar numbers. Subtracting out net departures from earlier years yields a slightly higher peak value, 218,000 net departures to December, and 136,000 at the end of February, which is coincidentally also the average for the post-hurricane period.

Source: Bureau of Transportation Statistics for San Juan, Aguadilla, and Ponce Airports.
By contrast, the Milken Study estimates a population reduction by approximately 8%, or 280,000 persons from September to February, about 276,000 if adjusted for the surfeit of deaths over births during this period.
Based on the data available to us, the Milken Study looks high by a factor of two. It is not clear how Milken’s incremental 140,000 decamped Puerto Ricans actually escaped the island. We believe a better estimate is the 136,000 incremental Puerto Ricans who, based on air travel records, were absent from the island on average during the Sept. 2017 – Feb. 2018 period.
Demographics of those leaving Puerto Rico
Milken’s assumptions about the age groups of Puerto Ricans who left the island after Hurricane Maria are not made explicit. The default expectation could be that PR residents left pro rata to their share in the population.
Nevertheless, this is not the historical precedent. Although the total population of the island declined by 446,000 in the decade to year-end 2017, the age cohort trends were quite varied. Almost half the decline came from children under 15, and the remainder from the 15-64 age group. The 65+ age group actually grew during the decade, up 34,000, with the senior cohort’s average age also rising. This is no different than population trends in, for example, other remote or rural areas: Young people move out; the elderly stay.

Source: Statista
Nor did this pattern appear to change in 2017. As part of its survey, the MPR Study asked island residents about migration patterns in the previous year. Their answers suggest that only 5% of those who left the island last year were 65 or older. By contrast, 15% of the island’s population falls into the 65+ age group.

Age Distribution of Persons who left and those who remained in Households in Puerto Rico, 2017
If we use the 5%/95% split for 65+ and all other age cohorts, then only 7,000 of the 136,000 who left the island were 65 or older, and 129,000 were in younger age groups.
The Milken Study reports that 77% of deaths on the island after Maria were of adults 65 years and older.
If we apply this rate to 136,000 Puerto Ricans on average who were absent from the island during the Sept.-Feb. period due to the storm, then 346 additional persons would have died had they stayed on the island through February 2018, with about half of these 65 or older.
Using these numbers, we can begin to assemble a complete view of excess deaths on Puerto Rico and of Puerto Ricans on the island as of Sept. 1, 2017.

Whereas Milken sees about 2,100 excess deaths during the Sept.-Dec. 2017 period, we see only 1,440, which if one used slightly different approachs could be +/- 200. For the Sept.-Feb. period as a whole, Milken sees nearly 3,000 excess deaths, whereas we estimate a much lower 1,525. Milken’s Sept.-Dec. estimates could be plausible if one assumed long-term trends in deaths were the right measure, rather than the 2015-2017 post-bankruptcy trend which we feel is more appropriate. Furthermore, one could generate a greater number of deaths from decamped Puerto Ricans if one assumed that a greater portion of elderly fled to the US to avoid the hurricane.
In the end, the Milken death estimates for year-end look a bit high, but not inconceivable. On the other hand, Milken’s Jan-Feb. estimates feel quite wide of the mark, given that 75,000 islanders returned from the US at that time. If an excess 900 people died during that two month period, it is unlikely so many would have returned, for it speaks to living conditions no better than during the immediate aftermath of the hurricane, despite the fact that 75% of the island had power on average during the January-February period. Further, no plausible linear regression can put death counts in Milken’s ballpark for 2018. Thus, Milken’s excess death estimates through Feb. 2018 look twice as high as a more plausible scenario.
The Bigger Picture
Whether 1400 or 2100 people died as a consequence of Hurricane Maria is, to an extent, a debate in semantics. A large number of people died prematurely due principally to a loss of power.
The extent to which this could have been avoided is an interesting question. We can compare the restoration of power to Puerto Rico and the Virgin Islands, the latter slammed by both Maria and Irma.
Despite all the problems with PREPA and logistics, power was actually restored on Puerto Rico faster than on the Virgin Islands through the end of the year. Thereafter, Puerto Rico lagged, but during the stages of elevated mortality, Puerto Rico was in no worse shape than the Virgin Islands, suggesting that logistics and geography were principally responsible for the delay in restoring power, at least through year-end.

Source: Various press reports, Princeton Policy analysis
The hope of quickly rebuilding a power grid in the event of a hurricane is probably too optimistic. The separate experiences of Puerto Rico and the Virgin Islands suggest that restoring power to even half the population can take four months, and about six months to complete the job.
Rather, efforts should be geared towards identifying and protecting those at risk, which the Milken Study indicates are men 65 or older most likely with serious pre-existing conditions. Policy should be geared to evacuating this group quickly from the island, gathering them in central locations with emergency power, or keeping a store of up to 1,000 portable generators to provide home power to this cohort. The cost of appropriate portable generators and three months of fuel, for example, comes out around $25 million – a drop in the bucket considering grid repair costs otherwise. In any event, reliance on grid resilience for islands exposed to full force hurricanes is almost certainly misplaced.
*****
Causes of Excess Mortality
The media and research institutions have focused heavily on the impact of Hurricane Maria on Puerto Rican mortality. This is understandable, but the data suggest Maria was just another nail in the coffin of Puerto Rico’s viability. Our analysis suggests that, just as the Obama administration warned, cuts to public services have indeed created a humanitarian crisis in Puerto Rico. Deaths did not start to rise with Maria. They started to rise in 2016, the year after Puerto Rico declared bankruptcy and the Congressionally-appointed Fiscal Control Board implemented major cutbacks in the island’s social safety net. To appearances, these cutbacks led to an increase in mortality – exactly the humanitarian crisis which was predicted. We estimate the excess deaths from PROMESA cuts in 2016 and 2017 at 1,050 to 1,300 depending on the approach used. This is not much less than the 1440 we attribute to Hurricane Maria.

Source: Government of Puerto Rico, Milken Institute, Princeton Policy estimates
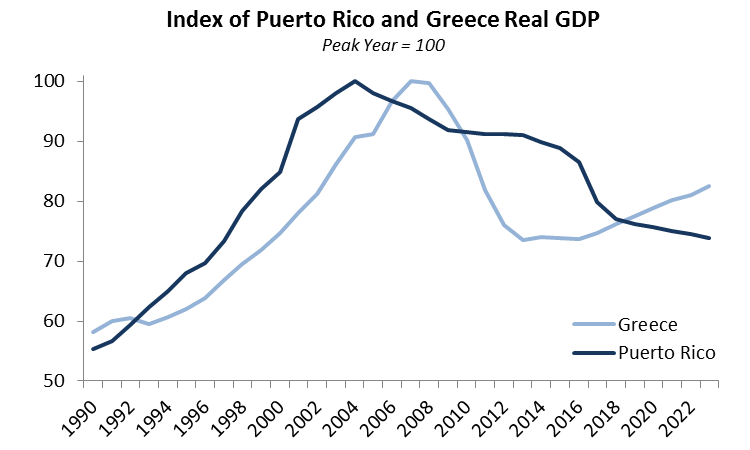
With more austerity coming, Puerto Rico’s prospects remain bleak. This year, Puerto Rico’s cumulative economic performance since the start of the Great Recession will be worse than that of Greece. Whereas Greece is recovering, the IMF expects Puerto Rico’s GDP to continue to fall as far as they eye can see. By 2023, Puerto Rico’s GDP is expected to be less than three-quarters of its 2004 peak.
Source: IMF April 2018 WEO
Hurricane Maria is thus but one chapter in two decades of Puerto Rican misery. Of course, a clear accounting of mortality from the hurricane is important. But we should not lose sight of the bigger picture, that the island is besieged from many sides, and Hurricane Maria is just a particularly bad chapter in a longer story of suffering and decline.