Rigs and Spreads Jan. 13: An uptick, but range-bound

  • Rigs counts were up

  • Total oil rig counts rose, +5 to 623

  • Horizontal oil rig counts also rose, +2 to 565, largely unchanged in the last three months

  • The Permian horizontal oil rig count was up, +3

  • The pace of horizontal rig additions rose to 0.0 / week on a 4 wma basis

  • The calculated US breakeven to add horizontal oil rigs fell to $80 / barrel WTI versus $78 on the screen at writing.  

  • Frac spreads rose, +4 to 254, no higher than in February

  • The DUC count is increasing by our calculations

    •  DUC inventory rose to nearly 20 weeks of turnover, the highest since March

  • Overall, the story is as it has been in recent times

    • Rigs, spreads and C+C production remains range-bound

    • As we have been commenting for months, the FT also notes that the shale revolution appears over

The Andurand Thesis

Pierre Andurand, the world's best known oil trader these days, believes that the market is underestimating the scale of the demand boost from the end of covid lockdowns.  Oilprice.com notes that Andurand sees the possibility of crude oil demand growing by more than 4 million barrels per day (mbpd) this year—a 4% increase over last year.  “I think oil will go upwards of $140 a barrel once Asia fully reopens, assuming there will be no more lockdowns," Andurand said.

This is quite an assertion, and as OilPrice notes, far exceeds the demand growth forecasts of other analysts. How well founded is Andurand's assertion?

There are many ways to create oil forecasts.  One of these relies on long-term trends.

Oil is a kind of utility for the global economy, that is, oil consumption tends to rise at a fairly steady pace from year to year with GDP.  At times, consumption grows faster than trend, but then a recession comes along and resets oil consumption to a lower level.  From there, demand tends to climb back to its long-term trend.  Indeed, if we project out a simple linear trend based on the years from 1997 to 2003, that is, before the rise of China and the subsequent 'peak oil' period, we can still predict with considerable confidence oil consumption twenty years later.  Consumption tends to return to its long-term trend

At present, we are off trend, and by quite a bit, due to the covid pandemic and the resulting lockdowns.  Compared to the '97-'03 trendline, consumption was 3.3 mbpd below expectations in 2022 and falls 3.4 mbpd below trend in 2023 compared to the EIA’s latest forecast.  To return to trend, consumption would have to grow 4.5% in 2023, just as Andurand contends.

Source: EIA, Prienga analysis

But the numbers may prove even more dramatic.  The '97 trend line does not fully consider the rise of China, which materially began to drive oil consumption growth from 2003, leading consumption to rise above the '97-'03 trend line during the 2004-2008 period.  This growth was reversed by the Great Recession and constrained by an oil supply unable to keep up with demand until mid-2014.  In August 2014, however, explosive US shale oil growth allowed supply to catch up to demand and cratered oil prices.  This allowed consumption to regain the 2003-2008 trendline which captures the rise of China.  In the three years before the pandemic, therefore, oil consumption was indeed on the trendline incorporating China's rise with no sign of an overheated oil market or an unsustainable trend in consumption.  Therefore, but for the pandemic, we would have expected world oil consumption at 105.8 mbpd in 2023, a full 5.3 mbpd above the EIA's current forecast for the year.

If long-term trends are the right approach to thinking about the future, then even Andurand's aggressive forecast may prove too tame.  The upside surprise could be as much as 6 mbpd.

Timing matters.  Returning to trend requires the material recovery of China's economy.  This may be expected in 2023, but politics in Beijing look fraught. A scary China may be a slower-growing China.  Further, the reversal of pandemic fiscal and monetary stimulus is expected to bring recession across much of the world.  And finally, the Russo-Ukrainian war throws a wrench into all predictions.  How and when the world returns to a pre-pandemic, pre-war normalcy is hard to know.  The long-term trends do, however, suggest it happens eventually.  

When it does, Andurand is likely to prove right and demand growth will exceed all expectations.  In such an event, a price forecast of $140 / barrel is by no means out of the question, and I would not be surprised if oil peaked, at least for a time, above $180 / barrel.

US Employment Trends March - December 2022

The March - December 2022 period proved quite unusual by historical standards. Although the employment level rose by more than 900,000 during this period, those employed full time actually declined by nearly 300,000, even as part-time workers soared by nearly 900,000 and multiple jobholders advanced by nearly 700,000.

A simple interpretation might suggest that service employees sidelined by covid returned to their jobs during this period, with some of them downshifting from full to part-time. Meanwhile, with price inflation running well ahead of wages for much of the year, many lower wage workers found additional jobs to help make ends meet.

Source: Labor Force Statistics from the Current Population Survey (LNS11000000, LNS12000000, LNS12500000, LNS12026619, LNS12600000)

Russia: Refined Products and the Oil Price Cap

The results of the Crude Oil Price Cap, which came into force on Dec. 5th, are mixed to date.  Contrary to the hopes of Price Cap proponents, Russia's oil exports in barrel terms have fallen.  Nor is the Price Cap binding for Russia's Pacific exports.  On the other hand, Russia's oil export prices toward Europe remain below the Cap limit of $60 / barrel, Russian oil revenues are down, and global oil prices remain comparatively subdued.  For the moment, the Cap can be considered a qualified success.

Source: Oilprice.com; Prienga analysis

The Price Cap and EU embargo will be extended to refined products on Feb. 5th.  Refined products comprise principally gasoline and diesel, but also include jet fuel (kerosene) and a variety of minor products.  In 2021, refined products constituted nearly 40% of Russian oil exports.  They are substantial.

Source: Reuters, UN Comtrade

Europe is Russia's largest traditional customer for refined products by far, taking about half of Russia's refined product exports in 2021. 

Source: BP Statistical Review

The practice continues.  European customers have been loading up on Russian imports, most notably diesel, with levels exceeding those of 2021.  Nevertheless, on Feb. 5th, EU imports of Russian products will effectively cease, representing a decline of perhaps 1.3 mbpd.  

Sales of refined products to countries willing to purchase from Russia may still be subject to the Price Cap if western shipping or service companies are involved.  According to guidance for products issued by the US Treasury last week, the maximum allowable payment to Russia is $60 / barrel, as it is for crude oil.

Given that European diesel futures are currently trading in excess of $125 / barrel equivalent, a $60 / barrel cap is quite a haircut.  Even allowing for lower value products like gasoline, the average value of refined products in Europe exceeds $110 / barrel.  In aggregate dollar terms, the difference between the market value of refined product imports to Europe and the Price Cap limit is about $25 bn / year.  That's quite a lot of money.

Who gets to pocket the difference?  

For starters, cheaper gasoline and diesel could benefit consumers.  Take India, for example.  Gasoline prices there are set administratively by the government.  During the pandemic, Indian pump prices tended to track Brent, just as did the Russian Urals price.   Since the start of the war, however, Delhi gasoline prices (our proxy for Indian gasoline prices) have tracked Urals rather than Brent.  This suggests that the Indian government has indeed passed on savings from cheap Russian oil to consumers.

Source: OilPrice.com; PetrolDieselPrice.com

Of course, the matter is not so clear-cut, as not all Indian refiners have had equal access to cheap Russian crude, and not all the resulting refined products have been sold domestically.  Some -- primarily state-owned refiners -- saw big losses in mid-2022 even as private refiners were re-exporting refined Russian crude as gasoline and diesel and reaping windfall profits.  

It is probably safe to say that large arbitrage profits, like those between market oil prices and the Oil Price Cap, are likely to be captured by private interests. For example, intermediaries like shippers may profit.  The Baltic Dirty Tanker Index, an average of tanker day rates on key crude oil trade routes, shows that crude tanker rates soared with the start of the war and peaked at nearly three times the long-term average heading into the Price Cap in early December.   On specifically Russian routes, the day rates may be sufficiently high to purchase the respective tanker with the profits from as few as two round trips.

Source: Investing.com

Any remaining windfall will accrue to purchasing entities, notably refiners, and associated government stakeholders.  Those most likely to benefit include Turkey; the Middle East, including Saudi Arabia; certain countries in Africa, for example, Nigeria; and, of course, India.  These countries may find it highly profitable to import heavily discounted Russian products for domestic consumption and export their own gasoline and diesel back to Europe.  

Source: BP Statistical Review

Of course, Russia could decide to cut production rather than selling at heavy discounts.  Nevertheless, this would appear unlikely.  Moscow has stated that it will not sell crude or refined products to countries which refuse to purchase those same products from Russia.  Substantively, this is a tantrum, not meaningful retaliation.  More importantly, the Kremlin has not refused to deal with service providers complying with the Price Cap.  Therefore, we can assume that Russia has elected to comply with the Price Cap for sales using western services to countries not in the Price Cap coalition, for example, to India.  On paper, Turkey should be the principal beneficiary, as Russian exports must travel only across the Black Sea to reach Turkish ports, and Turkey's product exports would not have to travel far to reach Europe.

To date, the Crude Oil Price Cap can be considered a success, but that success is principally due to demand weakness for oil products in China, Europe and the US.  At a guess, the Refined Products Price Cap is likely to produce similar results, possibly with a modest reduction in Russian exports accompanied by a re-working of refined product trade patterns with limited impact on gasoline and diesel prices.  

But the risks remain.  The chief among these is a recovery of the global economy, particularly China.  In such an event, oil prices could soar, and the Price Cap and its sponsors will find themselves taking the blame.

November Border Apprehensions: More Records

Customs and Border Protection reported 206,239 apprehensions at the US southwest border for the month of November.  It was, as every month it seems, yet another record.  Apprehensions were up nearly 40,000 on November 2021, which was a record for the month at a time.  Indeed, the greatest number of apprehensions outside the Biden administration was 76,200 in November 1999, during that fateful year of the Clinton administration. 

Apprehensions averaged 35,500 for the months of November during the Obama and Trump administrations.  Thus, as we have noted before, apprehensions are running at nearly six times 'normal' levels.

On the plus side (if we can put it that way), our forecast for fiscal and calendar year 2023 remains unchanged at 2.6 million, up 300,000 from 2022's record.

Inadmissibles, those presenting themselves at official crossing points without appropriate documentation, continues to run hot.   Calendar year inadmissibles are likely to come in at 240,000, which is an astounding number.  Inadmissibles used to be a small fraction of border encounters.  In 2022, the number of inadmissibles will be almost as large as apprehensions in a normal year.  Again, the simple interpretation is that Customs and Border Protection has been instructed to simply wave people through, hence the rising trend in inadmissibles. 

The "Feeble Joe" narrative is beginning to re-emerge.  The Oil Price Cap -- a terrible idea to begin with -- is threatening to self-destruct as oil prices rise due to collapsing Russian crude exports.  US military support for Ukraine is again being framed as excessively timid.  Ben Hodges, who served as commanding general of United States Army Europe, recently stated that "what would help Ukraine win would be for the White House to say we want Ukraine to win.  Here we are ten months into it, and they still can't get over that last little hurdle about saying we want Ukraine to win."   The perception of feebleness which characterized the Biden administration prior to February 24th is resurfacing, with border chaos a primary cause.

Let's hope the administration can steel itself, for the border is in utter chaos and emblematic of an administration spinning out of control.

Russian Oil Exports Collapse

Russian oil exports collapsed in the first full week of the Oil Price Cap regime, with Bloomberg reporting a decline in Russian loadings by 1.86 million barrels a day (mbpd), or 54%, to 1.6 mbpd.  

This was not supposed to happen.  Ursula von der Leyen, President of the European Commission, assured us that the Oil Price Cap would "stabilize global energy markets."   Similarly, US Treasury Secretary Janet Yellen, the chief advocate of the price cap, noted that "the objective is to protect the world from the consequences of a global spike in oil prices," and indeed, put  "downward pressure on global energy prices" by "maintaining a reliable supply of oil onto global markets", according to the US Treasury's website.  

These hopes were built on fragile and arguably improbable assumptions.  Maintaining a reliable supply depended upon 1) Russian compliance with the Price Cap and 2) western shipping, brokerage and insurance companies willingness to operate under Cap requirements; or alternatively, 3) Russia's ability to maintain exports levels in full circumvention of the Cap regime.

To the first point, Russia does indeed appear to be complying with the Cap.  The Kremlin has announced that Russia will not sell oil to countries in the Cap coalition, that is, countries which have, almost without exception, already barred Russian oil imports.  Putin is thus akin to the teenager who cries, "Yeah, I didn't want to go to your stupid party anyway!"  It radiates weakness and desperation.  Russia remains willing to place cargoes on vessels operating under Cap conditions.  The simple read is that Russia has caved.

The second condition is more problematic.  Western shipping companies appear to be shunning Russian cargoes.  Readers will recall that I warned specifically of this, concluding that "our analysis does not preclude a complete collapse of Russia's western crude exports."  One week of data is far from definitive, but still, collapse is exactly what Russian exports have done.  

This possibility seems to have eluded both the Treasury and the EU Commission, suggesting a policy process that was both insular and superficial.  

Treasury could claim that an oil export collapse could not have been anticipated. This argument would be more compelling had the EIA not been forecasting just such a collapse since July.  The EIA, formally known as the Energy Information Administration, is the energy markets analysis and forecasting arm of the US Department of Energy.   This is the home of oil markets expertise in the US government and just a 20 minute walk from the US Treasury building.  The due diligence process should have started with a call from Treasury to the EIA and its experts.  EIA analysts are not only competent, but in my experience, accessible and really nice people.  Treasury would quickly have learned that the EIA anticipated the Price Cap would lead to a 2 mbpd drop in Russian production, as compared to the 1.9 mbpd fall booked last week.  

The EIA staff would have explained their thinking, which should have prompted Treasury to conduct further due diligence, notably discussions with shippers, insurers, brokers and other stakeholders, including oil companies like Shell.  This does not appear to have happened.  Oil prices, for example, are not set in dollar terms the way Treasury supposes, leading to confusion about whether brokers were complying with Cap requirements or not.  Similarly, chaos broke out at the Bosporus Strait when Turkish officials refused passage to tankers without specific insurance guarantees for that particular crossing, something insurers do not ordinarily provide.  (Imagine, for example, GEICO being asked to provide specific insurance proving that you are covered to drive across the George Washington Bridge.)   Further, Shell stated that it would not hire tankers previously contracted to carry Russian cargoes for fear Russian crude dregs would remain in the tanks, thereby exposing Shell to the risk of violating Cap terms.  This alone has deterred shippers, not to mention other considerations.  Had Treasury conducted any of this due diligence -- less than a week's work for an analyst -- it would have known that the risk of western service providers balking at the Russian trade was quite possible and likely probable. 

The situation might yet have been saved by Russian craftiness in assembling a 'shadow fleet' of tankers and by Russia providing its own in-house insurance, which would have allowed Moscow to evade the Price Cap.  Alas, Russia has developed a reputation for titanic incompetence in recent months, not only in military affairs, but also in oil export management, it seems.  Shipping consultancy Braemar has estimated that Russia needed about 240 tankers to conduct its crude export trade and would fall short 100-110 tankers in the event western service providers were unwilling to carry Russian cargoes.   The early data looks even grimmer, with trade down more than 50%.  Russian incompetence never fails to astonish.

Source: Braemar

Napoleon Bonaparte once famously stated, “I'd rather have lucky generals than good ones."  Treasury and the EU Commission have been lucky to date.  A loss of 2 mbpd of supply is large by global standards.   As a rule of thumb, every reduction of the oil supply by 1 mbpd (1% of global demand) should lead to an increase in the oil price by roughly $10 / barrel.  Therefore, the current collapse of Russian oil exports, should it be sustained, might be expected to increase oil prices by $20 / barrel, all other things equal. This would prove a political disaster for the Cap's advocates and the western allies more broadly. 

Treasury's good fortune, if we can call it that, is that all other things are not equal.  Notably, the world appears to be sliding into recession, with the result that oil prices have been falling on their own.  A global downturn may yet save the optics of the Price Cap.  True, this is akin to a cardiologist being relieved that his heart patient died of cancer, but still, sometimes one has to take their wins where they can find them. 

It is still early days for the Oil Price Cap regime.  Perhaps western shippers and insurance companies will become more comfortable with the Russian oil trade under current rules.  Perhaps the Russians will collect themselves and quickly assemble an alternative fleet to move their oil.  Or possibly a global recession may render the entire issue moot.  

Be that as it may, the assumptions underpinning the Oil Price Cap have proven faulty to date. Should the global economy not implode, the political risks for the Cap advocates will rise sharply.

Some Price Cap Graphs, Thoughts on Russian Strategy

A couple of graphs on Russian oil prices (Urals-Brent) and the Urals Discount.  

The published Urals price -- the price Russia receives for oil exports towards Europe -- has collapsed to under $50 / barrel.  This is $7 / barrel below the average Russia received during the 2015-2021 period, when Urals averaged about $56 / barrel.  We place the fiscal breakeven for Russia at around $80 / barrel in September, as that is the point at which Putin called for production cuts.  That is, when Urals fell back below $80, Moscow was looking for price support.  Therefore, based on observed behavior -- not a calculation of Russian budget requirements -- we can make a case for an $80 Urals fiscal breakeven for Russia in September.  In our view, this breakeven has probably risen since then, perhaps materially (and our breakeven assumes normal levels of oil and gas exports from Russia).

Source: Oilprice.com, EIA, Prienga analysis

The Urals Discount is the difference between the European benchmark Brent oil price and the Urals-Brent oil price Russia receives for Europe-bound exports.  The Discount did not visibly increase from recent levels of $23 / barrel in the first week of the Cap.  However, it is important to note that Urals prices are released with a delay and only a few times per week, and therefore published prices may not reflect market realities in the very short term.  

Yesterday opened with the Discount rising to $29 / barrel, suggesting that Russia is struggling to find buyers for its western crude exports.  

Source: Oilprice.com, EIA, Prienga analysis

I will have more on this topic later.  For now, I think it important to note that our analysis does not preclude a complete collapse of Russia's western crude exports to the extent Russia cannot place them on its own and allied 'Shadow Fleet'.  

The western supply chain -- the shippers, insurers and the rest -- may decide to avoid the Russian business altogether.  Were I a P&I insurer, I would walk away from the Russia business without a thought if it were less than, say, 10% of my revenues.  Not worth the risk and hassle.  Without insurance, the tankers will not move the crude, and the Baltic and Black Sea trade will collapse to the extent Russia is unable to ship the oil on its own and allied vessels.  

Moreover, it would seem suicidal for Putin to acquiesce in the Price Cap, as that can only lead to worse later.   Were I the Russians, I would continue production, but drain the excess crude into a giant pit fashioned into an appropriate symbol and set it on fire, making quite literally a flamboyant gesture visible from space.  That's more the Ukrainian's style, but if Russia caves to Cap requirements, the allies will know that they have Putin right where they want him, only a few moves from checkmate.  

That Russia is earning less export revenue is all good for Ukraine (although the Discount itself is a mortal threat).  On the other hand, if the global economy fails to collapse, the potential for Brent to add a quick $30 / barrel is very much on the table.  That won't go over well in western capitals.  For that reason, cutting oil exports sharply is probably Putin's best bet.

October Border Apprehensions: Worse and worse; 2.6 m for 2023

Customs and Border Protection reported 204,273 apprehensions at the US southwest border for the month of October. This is comfortably the highest on record for the month, besting last year's record by 28%. To put it in context, October's apprehensions were more than double the third highest October, set in 1999 under the Clinton administration.

Apprehensions in October also continue to run ahead of our forecast, 31,000 above expectations. As I have noted for the last several months, conditions at the border appear to be deteriorating even compared to the outlandish levels seen to date under the Biden administration. Thus, our 2022 calendar year forecast is raised to 2.3 million, up from 2.1 million expected as of this past January.

We also make our first forecast for southwest border apprehensions for calendar and fiscal year 2023, both coming in at 2.6 million, that is, 300,000-500,000 higher than in 2022. I personally hoped that the 2022 numbers were as bad as it gets, but clearly, the mayhem at the border has upside potential. Of course, it is early days to make a hard call for 2023. Nevertheless, based on the last two months, 2023 should set yet another record for illegal border crossing -- and by a substantial margin over 2022. This coming March, April and May in particular could post some spectacularly ugly numbers.

Inadmissibles, those presenting themselves at official crossing points without appropriate documentation, continues to run hot. CBP reports 26,405 inadmissibles for October, the second highest month for any month in the past ten years. The record, 32,281, was set by the Biden administration this past April. The numbers once again suggest permissive conditions at official entry points at the southwest border.

I find it difficult not to feel a certain chagrin with the Trumpians in this past election. In the House, the Democrats over-performed by 30 seats. That is, a statistical regression would have predicted a loss of 39 seats in the House given President Biden's approval rating at the time. As of writing, the Democrats will have lost only 9, ceding a narrow majority to the Republicans.

Part of the Democrats' relative success may be attributed to the Ukraine war. A first-term president last saw a gain in the House in 2002, when President George W. Bush enjoyed an outpouring of support following the 9/11 attacks on the US. Wars tend to support incumbents electorally -- at least in the early stages of the conflict. The Russo-Ukrainian war probably helped the Democrats at the midterms.

Nevertheless, the problems run deeper for the Republican Party. Trump-endorsed candidates largely alienated centrist independents. As Karl Rove writes in the Wall Street Journal:

The election results do reflect a problem of substance, specifically the damage Republicans did with candidates who went full-on Trumpy. If they echoed the former president’s issues, tone and stolen-election claims, they often lost and in almost every case ran behind the rest of the Republican ticket.

The principal reason Republicans came up short was that just when Americans were ready to vote for them to check Democratic excesses, the GOP nominated too many radicals and weirdos.

This is now the third time President Trump has cost the Republicans control of the House or Senate. What is the takeaway for the Biden administration? Is tightening up the border a political necessity? Or will 2.6 million apprehensions at the border in 2023 become just another business-as-usual statistic, another benchmark for acceptable border anarchy?

Until the Trump Republicans nominate candidates acceptable to the median voter -- in the US, a suburban, two-car-garage independent -- Democrats will set the political agenda, and the border is likely to remain wide open.

Apprehensions shatter fiscal year record

Customs and Border Protection reported 207,597 apprehensions at the US southwest border for the month of September. This bests by 22,000 the prior record for the month, set last year by the Biden administration. Moreover, September apprehensions came in 50,000 above our forecast of 157,000. This is our biggest miss of the year and reflects an accelerating pace of apprehensions when they should be declining seasonally. That is, since July, the relative pace of apprehensions has been accelerating even compared to the stratospheric levels now normal in the Biden administration. This speaks to both a strong US labor market and deteriorating enforcement at the border.

As expected, for the fiscal year ending September 30th, the Biden administration has set a new record for apprehensions at 2,206,436. This shatters the prior record of 1,658,206 set by the Biden administration last year. Indeed, fiscal year 2022 apprehensions ran at five times the pace of the Obama administration and four times that of the Trump administration. Apprehensions under the Biden administration are not merely worse than under his predecessors, they are in an entirely different class. Nevertheless, apprehensions came in just above our forecast of this past January. We anticipated 2.1 million apprehensions, thereby undershooting the actual number by 0.1 million. The difference is due principally to the super surge of the last three months.

It is early to make a prediction for FY 2023 apprehensions. Certainly, the short-term trend suggests next year could post yet another record. Nevertheless, we are currently anticipating a sharp economic downturn from Q1, and apprehensions tend to track US job openings. Therefore, we are penciling a decline in apprehensions for 2023, and therefore FY 2022 may become the all-time record holder in the long term. Not a record the Biden administration may wish to own.

*****

Inadmissibles, those presenting themselves at official border crossings without appropriate documentation, has also been running hot. For the month of September, Customs and Border Protection reported 19,950 inadmissibles at the US southwest border, once again a record for the month stretching back to 2012, which is as far as our monthly data extends. For the fiscal year, inadmissibles totaled 172,508, 12% higher than the previous record set under the Obama administration. That these numbers are so high once again suggests that entry conditions are permissive at the border. Undocumented migrants are attempting to cross at official entry points because they are aware their chances of success are relatively high by historical standards.

One struggles to comprehend what the Biden administration is thinking. Many months ago, I wrote that the Biden administration was likely to set an all-time record for border apprehensions, and that the fiscal year numbers would be published within three weeks of the election, thereby ensuring that the Democrats would take a hit in the midterms. And so it has proved. By rights, the administration should have substantially tightened border control for the last two months to depress the apprehension numbers heading into November. Just the opposite has happened. The data show deteriorating conditions, even compared to the lofty standard the administration has set. Why? It speaks not only to an indifference towards public sentiment, but to visible incompetence in the administration. September's numbers were not only bad policy, they are bad politics.

Finally, I wrote more than a year ago that open borders would torpedo the prospects for both DACA and Dreamers-related legislation. And so it has proved. With a majority in both houses and many Republicans sympathetic to the plight of DACA participants, the Biden administration had an opportunity to pass legislation normalizing the status of at least those in the DACA program, and perhaps as many as two million undocumented immigrants in total. Given the choice, however, the administration chose to keep the border open and thereby make the topic of status normalization radioactive. Republicans will likely take the House and possibly the Senate in the midterms. As a result, the window for normalization is likely to remain shut, possibly to 2030 or beyond, as I wrote well over a year ago. Here, too, open borders proved both bad policy and bad politics.

*****

I personally like Joe Biden, even in his increasingly fossilized state. Moreover, I worry that Republicans believe that America can prosper and be a decent country without democracy. As someone whose family endured fascism and lost everything to communism in Hungary and later struggled under Argentina's Personist populism, I value democracy and sound governance. I take none of it for granted. Those who are enamored with autocracy are fools. Nevertheless, democracy has to translate into competence and values acceptable to the median voter. If the Average Joe believes that democracy no longer serves his interests, then the republic will struggle to survive. Those who value our democratic traditions need to keep that in mind.

August SW Border Apprehensions: FY Record, also Martha's Vineyard

Customs and Border Protection reported 181,160 apprehensions at the US southwest border for the month of August. This was essentially unchanged from the prior month and was the second highest August on record, bested only by last year's 195,500.

Apprehensions for the month were once again running ahead of our forecast, 18,000 above our forecast of 163,000. Ordinarily, apprehensions decline seasonally heading into the fall. They did not this year, probably due to a revival of the US job market from mid-summer, as well as, of course, the de facto open borders policy at the Rio Grande. Fiscal year-to-date apprehensions have reached 2.0 million, a new record, even with one month left in the fiscal year. This comfortably exceeds the prior record of 1.66 million set by the Biden administration in fiscal year 2021.

Our apprehensions forecast for the fiscal and calendar year nudges up to 2.2 million due to rounding, but remains essentially unchanged since we first published it in January.

Inadmissibles, those attempting crossing at official entry points without appropriate documentation, also rose in August. There is no obvious explanation for this, other than that such persons are being granted entry into the US interior. As such, both the apprehensions and inadmissibles numbers suggest a weakening of border control over the last two months.

Martha's Vineyard, Hypocrisy and Cynicism

In a cheeky move, Florida Governor Ron DeSantis flew four dozen migrants to Martha's Vineyard last week. This has created quite the brouhaha up here in Cape Cod, but it highlights the hypocrisy of the 'enlightened' left, as well as showing DeSantis capable of cynically deploying undocumented immigrants to make a political point.

Hypocrisy means acting in a manner inconsistent with one's stated beliefs. A prohibition -- including one in migrant labor -- creates such hypocrisy by pitting one's self interest against his social interest. That is, the elites of Martha's Vineyard claim to be all for poor, undocumented migrants, but not in their town. DeSantis, by shipping migrants to the Vineyard, has exposed this hypocrisy, but in a cynical way. DeSantis was not principally motivated by the ostensible goal of providing jobs for migrants, but rather intended to damage the reputation of the left by exposing their hypocrisy in the matter.

Thus, hypocrisy implies actions contradicting stated beliefs, and cynicism implies looking for hidden intentions behind those ostensibly motivating action. In both cases, self-interest is divorced from social interest. The individual is motivated to act in contraction of his stated goals or beliefs.

To attribute hypocrisy to the left or cynicism to DeSantis misses the point. Such anti-social behavior arises from US government policy, which sets the price of a work visa close to zero and consequently provides a grossly inadequate number of visas for those who desire them. The predictable result is a black market in migrant labor where all the participants have an incentive to behave in a manner inconsistent with their stated goals and beliefs. Hypocrisy and cynicism are but side effects of trying to enforce a prohibition, and this applies to all prohibitions and black markets. For example, the EU's embargo on Russian oil -- another prohibition -- exhibits the same traits in an even more pronounced fashion..

Solving the problem does not require moral rectitude. Instead, in the case of migrant labor, H2 visa issuance has to change from a volume-based approach to a market-price based approach. If visas were available at their true market value, migrant-related cynicism and hypocrisy would disappear, not in years, but in days.

SW Border Apprehensions: New Fiscal Year Record -- with two months to go

Customs and Border Protection reported 181,522 apprehensions at the US southwest border for the month of July. This was by a large margin the second highest in the record, with the previous record set by the Biden administration in July of last year.

SW border apprehensions were the lowest since March, but nevertheless came in above our forecast. Ordinarily, apprehensions peak in the spring and decline during the course of the summer. This pattern is visible this year as well, but the decline was less than expected based on seasonal factors. Our July forecast, at 166,000, fell 15,500 below the reported number.

Martha's Vineyard, Hypocrisy and Cynicism

​In a cheeky move, Florida Governor Ron DeSantis flew four dozen migrants to Martha's Vineyard last week. This has created quite the brouhaha up here in Cape Cod, but it highlights the hypocrisy of the 'enlightened' left, as well as showing DeSantis capable of cynically deploying undocumented immigrants to make a political point.

Hypocrisy means acting in a manner inconsistent with one's stated beliefs. A prohibition -- including one in migrant labor -- creates such hypocrisy by pitting one's self interest against his social interest. That is, the elites of Martha's Vineyard claim to be all for poor, undocumented migrants, but not in their town. DeSantis, by shipping migrants to the Vineyard, has exposed this hypocrisy, but in a cynical way. DeSantis was not principally motivated by the ostensible goal of providing jobs for migrants, but rather intended damage the reputation of the left by exposing their hypocrisy in the matter.

Thus, hypocrisy implies actions contradicting stated beliefs, and cynicism implies looking for hidden motivations behind those ostensibly motivating action. In both cases, self-interest is divorced from social interest. The individual is motivated to act in contraction of his stated goals or beliefs.

To attribute hypocrisy to the left or cynicism to DeSantis misses the point. Such anti-social behavior arises from US government policy, which sets the price of a work visa close to zero and consequently provides very few visas for those who desire them. The predictable result is a black market in migrant labor where all the participants have an incentive to behave in a manner inconsistent with their stated goals and beliefs. Hypocrisy and cynicism are but side effects of trying to enforce a prohibition, and this applies to all prohibitions and black markets. For example, the EU's embargo on Russian oil -- another prohibition -- exhibits the same traits in an even more pronounced fashion..

Solving the problem does not require moral rectitude. Instead, in the case of migrant labor, H2 visa issuance has to change from a volume-based approach to a market-price based approach. If visas were available at their true market value, migrant-related cynicism and hypocrisy would disappear, not in years, but in days.

June Southwest Border Apprehensions: Record high. At forecast

US Customs and Border Protection reported 191,898 apprehensions at the US southwest border for June. This is comfortably a record for the month, almost twice the pre-Biden record of 115,000 set in June 2000 under the Clinton administration, and even 13,000 above last year's 177,000, a record for June at the time. At the same time, apprehensions were right on our forecast, and indeed, apprehensions have been following our forecast closely for the first half of the year, suggesting that border conditions are largely unchanged since the Biden administration took office.

Illegal immigration from traditional sources, notably Mexico, Guatemala, Honduras and El Salvador, has been below that of last year since March. We presume that such immigrants are well informed about labor market conditions in the US, as they have a wide variety of sources within the US to direct them to job openings. Migrants may be perceiving softness in demand for their labor.

At the same time, a key source of border crossing growth has come from the 'Other' category, that is, countries historically not a major source of illegal immigration. In March-June 2019, for example, an average of 13,000 migrants from 'Other' countries were arrested crossing the border monthly. In the same period this year, the average was 100,000 per month. One can imagine all sorts of legacy problems arising from the growth of 'Other' apprehensions. They will create a pipeline of illegal immigration that will long outlast the Biden administration.

Our fiscal year 2022 forecast for southwest border apprehensions remains unchanged at 2.1 million, by far an annual record and nearly 500,000 higher than the previous record set by the Biden administration last year.

Inadmissibles, those presenting themselves at official crossing points without appropriate documentation, have fallen sharply, with most of the decline coming from the 'Other' category. These were, in all likelihood, disproportionately Ukrainians fleeing the war, with their numbers declining as the situation has stabilized there.

Overall, the situation at the border is largely unchanged. The Open Borders policy remains in place.

I would note that, were we to use a market-based visa system, the US could have booked $30 bn in visa revenues this year from those otherwise entering illegally during the Biden administration. The border would effectively be closed to illegal immigration; all those working in the country would be legal and willing to return home; and these 53 migrants would still be alive.

The Pandemic and US Fiscal and Monetary Policy Errors

[Updated on July 11]

With surging inflation and looming recession in the US, economists and policy-makers have begun a belated round of soul searching about what went wrong. The critical mistake appears to have been conflating a suppression with a depression. Other mistakes followed from this fundamental misconception.

When the pandemic hit, policymakers adopted the 2008 experience as the template and decided to ‘go big or go home’. This was not entirely without cause. The decline in GDP and employment was far more acute in the 2020 pandemic than it had been in the Great Financial Crisis of 2008-2009. Indeed, GDP declined by twice as much in early 2020 as it had during the Great Recession.

Therefore, the Fed and the Biden administration deemed a much larger stimulus and fully accommodative monetary policy to be appropriate. Unfortunately, this involved an error of construction, the mistaking of a suppression for a depression.

Source: FRED, Princeton Policy Analysis

We define a depression as an economic downturn linked to a large decline in house values. When this occurs, households cannot use their homes as collateral for borrowing, as their dwellings are often worth less than the amount owed on the mortgage. Instead of borrowing more, homeowners are forced to slowly pay down their mortgages and re-establish positive net worth in their homes. The economy struggles as consumer borrowing is depressed for the many years borrowers require to regain home equity.

In such cases, as in both the Great Depression and after 2008 (which we refer to as the ‘China Depression’), the US Federal Reserve Bank reduced the benchmark Federal Funds Rate (FFR) effectively to zero percent, not for months, but for seven years. Because consumers were unable to refinance due to impaired home values, such low interest rates had no notable effect on house values, stock prices or inflation in the decade after 2008.

By 2017, however, home values had recovered, and by the time the pandemic hit, consumers were prepared to borrow and spend.

*****

The term ‘suppression’ is not commonly used in economics. Indeed, the profession does not distinguish among recessions, depressions or suppressions.

As used here, a suppression means a reversible outage, an exogenous restriction on economic activity. In this case, the suppression arose from pandemic-related lockdowns and spontaneously from the public’s fear of infection were they to leave their homes. None of this had anything to do with the business cycle.

To illustrate, consider a hypothetical teenager, Bobby. Imagine Bobby had the flu, and a doctor gave him stimulants and medicine to feel better. After a while, he would recover and gradually rejoin society. This describes a typical recession.

Now imagine instead that Bobby’s parents had grounded him and confined him to his room. At the same time, those same parents gave him $50 and some amphetamines to stimulate his activity. Bobby, when released from his captivity, would come out amped up and ready to spend.

That is the difference between suppression and a recession, and it illustrates why the economy rebounded much more quickly than the Federal Reserve expected.

By mistaking a suppression for a depression, the US government set both fiscal and monetary far too loose.

Consider fiscal policy. At the beginning of the pandemic, in Q2 2020, the output gap (the difference between potential GDP and the actual output of the economy), rose to $2.1 trillion or about 12% of GDP. This prompted the government to borrow $3.4 trillion, half again as much as the gap, to distribute as stimulus payments and other support to the economy.

Source: FRED, Princeton Policy analysis

Were this a depression, the gap likely would have persisted. But as it was an outage — a suppression — the gap closed immediately, down almost 60% by the next quarter. By year-end 2021, the gap had effectively disappeared. Meanwhile, the government had continued piling on debt, such that Federal debt today is nearly $7 trillion, 30% of GDP, higher than it had been prior to the pandemic. This is a colossal amount of borrowing in a very short time. In an ordinary year, government borrowing might increase by 2-3% of GDP. The pace of debt accumulation from the start of the pandemic was almost an order of magnitude higher, representing the most radical increase in US borrowing in its peacetime history. This was a grand and perilous experiment in US fiscal policy.

Unsurprisingly, such debt-fueled stimulus led to a rapid and unsupportable increase in demand. Since the US economy could not produce sufficient goods to cover the stimulus, imports soared, leading to record trade deficits and bottlenecks at ports like Los Angeles and Long Beach. Inventories were stripped across the economy. New and used cars were scarce. Items normally available in demand, for example bicycles, became rationed, with retailers hoarding items like the spare parts necessary to run their maintenance operations. A flood of stimulus money blew up the supply chain.

With the stimulus winding down, this process has begun to reverse. Retailers like Wal-Mart and Target reported record increases in inventories in Q1 2022. Previously placed orders arrived just as the stimulus began to wear off. Where inventories had been scarce, suddenly retailers had too many goods in their warehouses. Mark-ups are being replaced by discounts. After the party of cash handouts to the public, the hangover is now on us.

On paper, the roll-off of the stimulus should lead to a technical recession with a decline of perhaps 4% of GDP. Accordingly, GDP declined by 1.6% in Q1 and a number of forecasters see negative growth in Q2 as well. The Federal Reserve Bank of Atlanta, for example, projects Q2 GDP growth at -1.2%. If expectations of decline prove correct, the first half of the year would qualify as a recession by the two negative quarters standard.

Such a technical recession need not cause high unemployment. With the end of World War II, US government spending collapsed, leading the economy to contract by 11% in 1945, but with almost no impact on employment. Brisk growth resumed the following year. If that precedent applies in the current case, growth might resume in the second half of 2022 as the effects of the stimulus wash through the system.

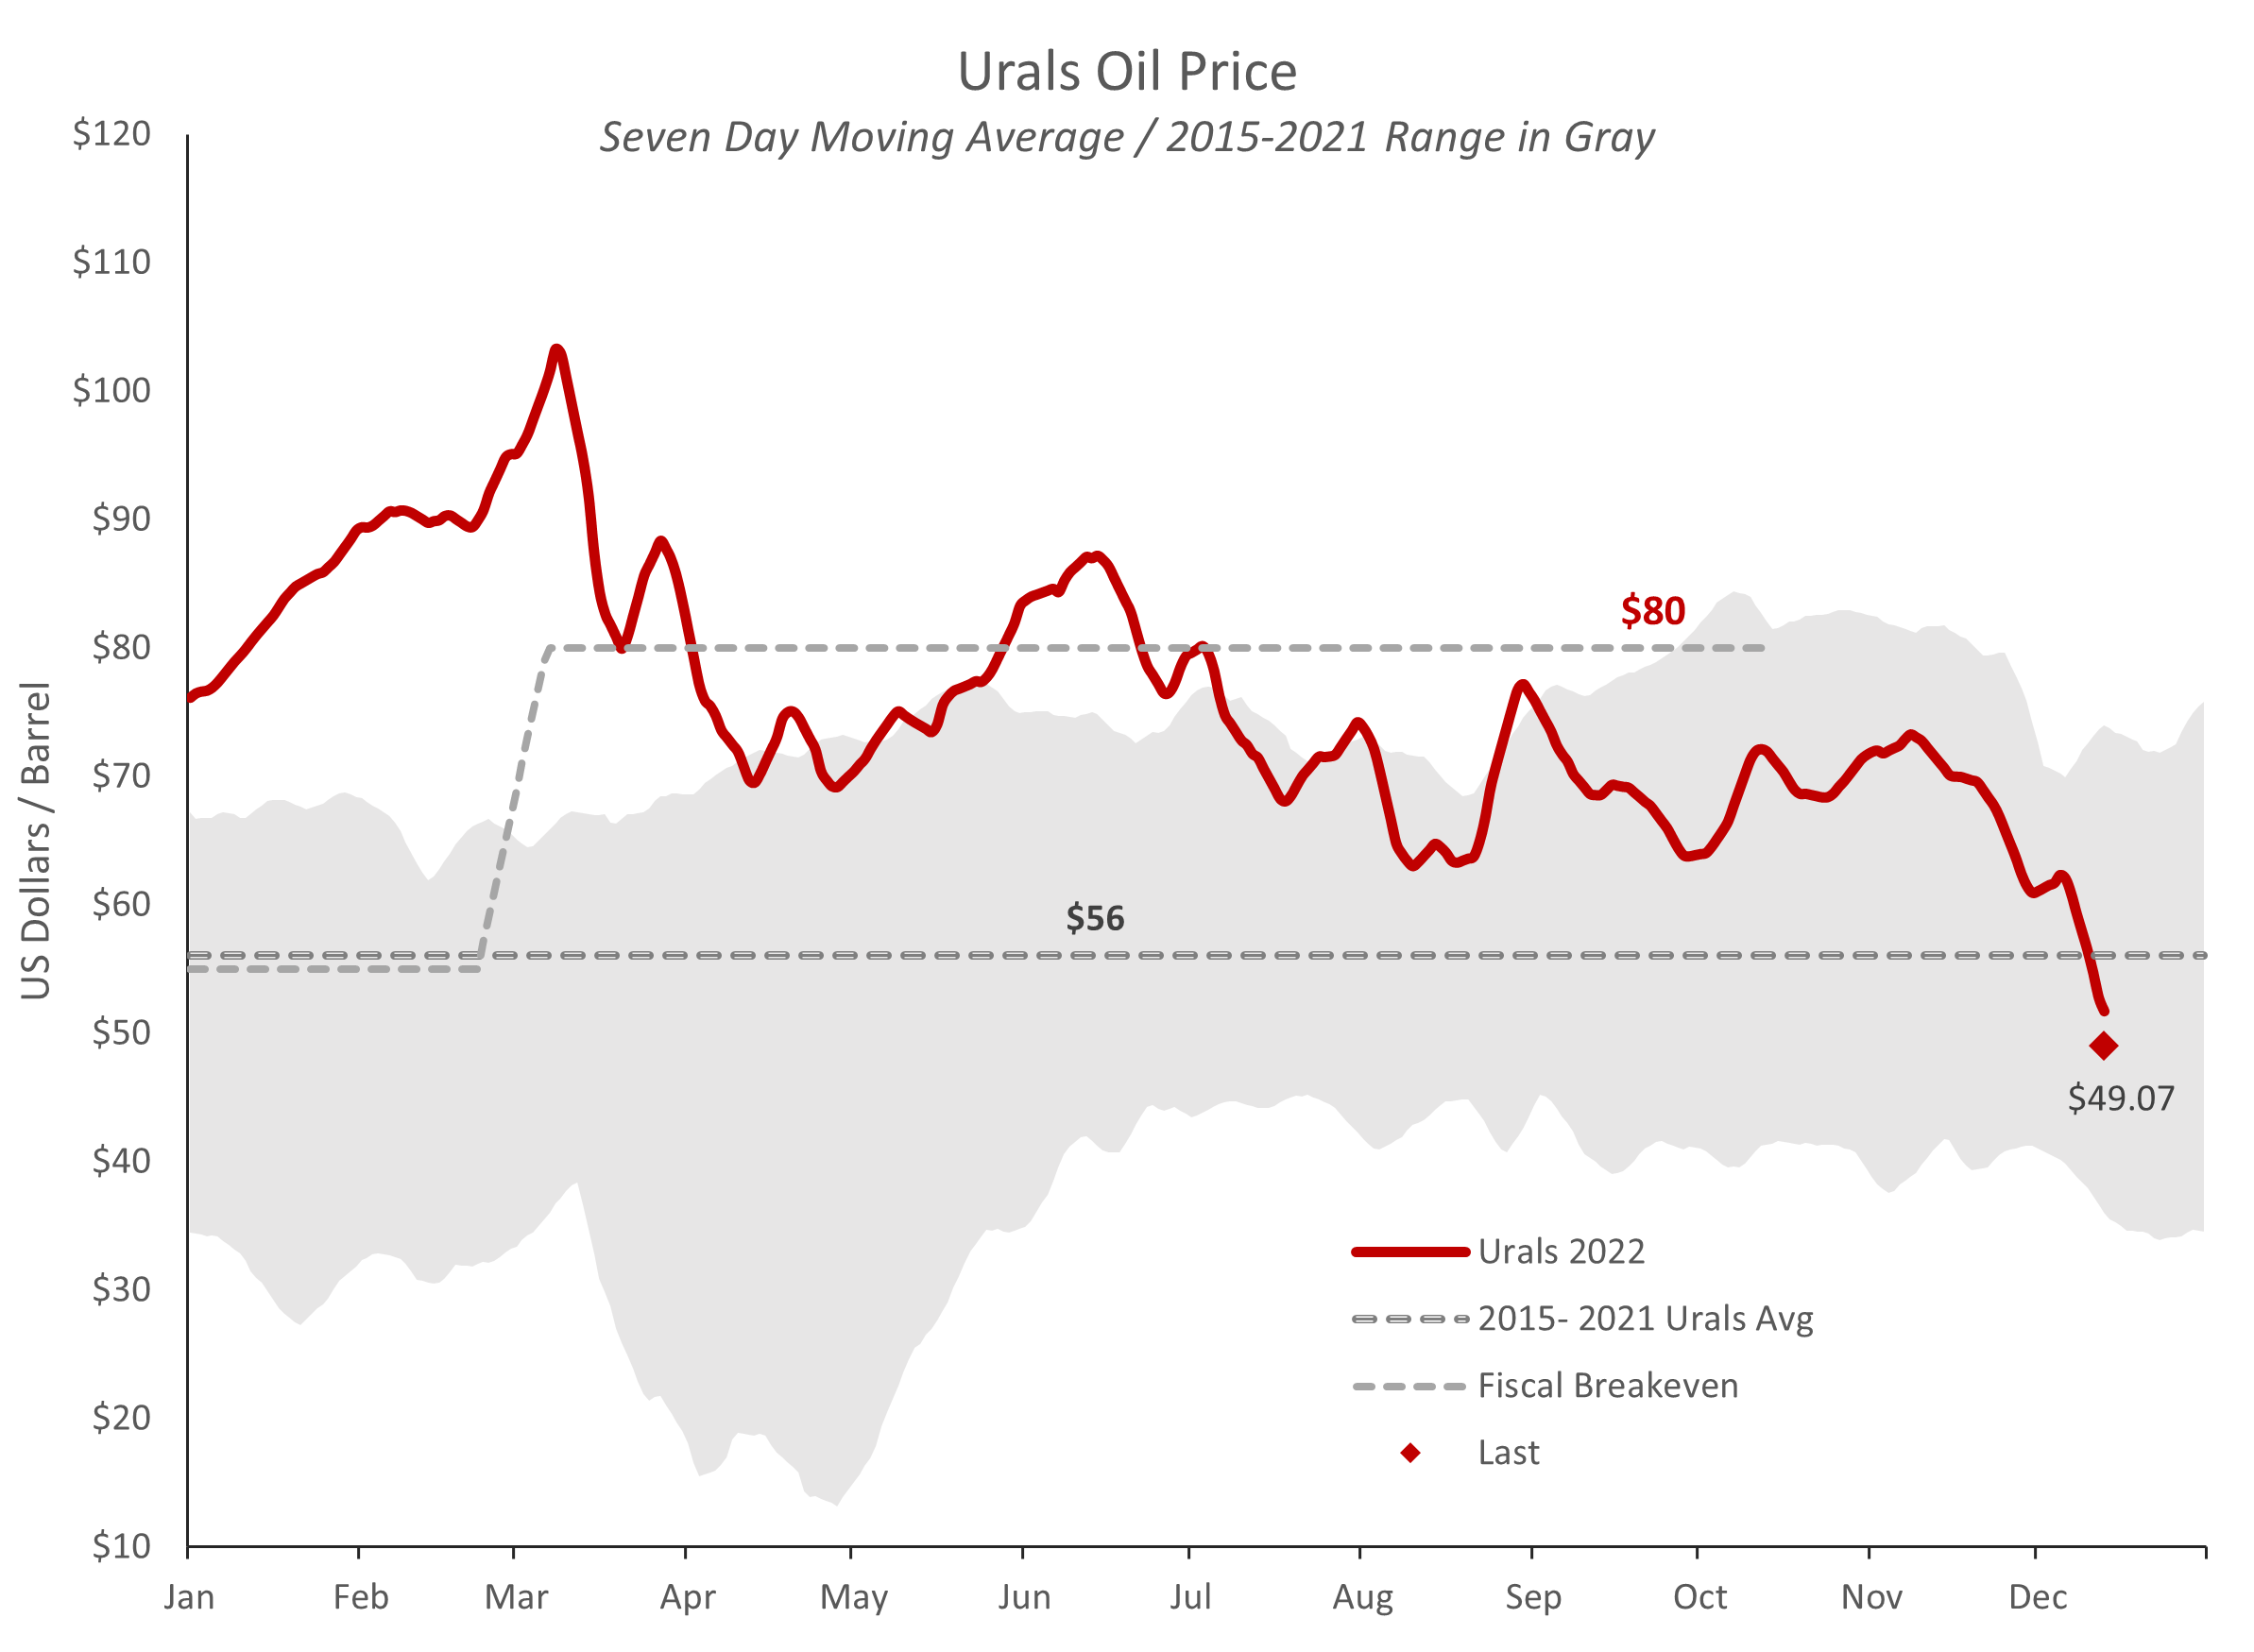
However, there are two complicating factors. The first of these is high oil prices and, even more notably, high gasoline and diesel prices. The last time the world saw such high prices, from 2011 to 2014, Europe slumped into a five quarter recession and the US struggled with ‘secular stagnation’. The story may be repeating itself now, with 55% percent of the US public believing that the country is in recession already, paired with consumer sentiment at its lowest level in seventy years. Both these polls reflect a public under considerable stress from inflation, most notably in energy prices. Ordinarily, such sentiment would be linked to looming recession.

High oil prices often occur in the context of rising interest rates, and this time is no different. As the Fed misdiagnosed the pandemic downturn, monetary policy was set far too loose, contributing to the worst inflation in forty years. As is typical in such cases, the Federal Reserve has started to raise interest rates to suppress the demand for money and thereby reduce inflation.

Not everyone believes the money supply and inflation are linked. In December 2021, Federal Reserve Bank chairman Jerome Powell told a House committee that the once-strong link between the money supply and inflation “ended about 40 years ago.” Powell’s beliefs rest upon the relationship of the money supply to inflation from the start of the Great Recession. From late 2007 until the start of the pandemic, M2 had risen by 60% more than GDP growth, and yet cumulative inflation over that 12 year period was only 20%. The Fed could print money with impunity, it seemed.

Standard economic theory, by contrast, attributes inflation principally to growth in the money supply. The Nobel laureate economist Milton Friedman famously said that “inflation is always and everywhere a monetary phenomenon, in the sense that it is and can be produced only by a more rapid increase in the quantity of money than in output.” M2 is a widely used measure of the quantity of money, and it has increased by 39% since the start of the pandemic.

If Friedman were correct, we would expect prices to rise by the increase in M2 less the increase in GDP. GDP has risen by 5% since the beginning of the pandemic, and therefore we might expect prices to rise cumulatively by 34%, all other things equal.

Source: FRED, Princeton Policy analysis

There does, however, appear to be a lag between an increasing money supply and inflation. As the website of the St. Louis Federal Reserve Bank notes:

During periods of underutilization, when the money supply is increased, there will be an increase in output; however, as those idle resources are utilized—as idle factories return to production and the labor market begins to tighten up—an increase in the money supply will be reflected in the price level. This is inflation caused by too much money chasing too few goods.

And this indeed appears to correlate to the historical record. During inflationary periods of the past sixty years, observed inflation rates lagged increases in the money supply. However, several quarters after the deployment of monetary stimulus, the trend line took a ‘right turn’, as can be seen on the graph above, and inflation continued without further monetary easing. Such inflation can continue for several years as prices catch up with prior increases in the money supply.

Interestingly, observed inflation can often surpass increases in M2. After 1975 and again after 1983, cumulative inflation amounted to 5-10 percentage points more than the growth of M2 adjusted for real GDP growth would have suggested.

Source: FRED, Princeton Policy analysis

With this model, commonly referred to as the Quantity Theory of Money, we can consider the nature of monetary policy resulting from the pandemic. As with earlier episodes, recent monetary easing did not, in the initial phases, lead to the level of inflation predicted.

However, we appear to be at the inflection point now, as the trend line turns to the right, with high inflation even in the absence of further monetary accommodation. The vast increase in the money supply is beginning to make its way into the economy.

The increase in the money supply has been simply staggering, more than twice the relative size of monetary accommodation in the early 1970s associated with the first oil shock, and three times the size associated with the second oil shock in the last 1970s. Both of those episodes led to brutally high levels of inflation. The current bout could be 2-3 times worse if the model holds up.

Thus, if precedent applies, inflation could average 2-3 percentage points per quarter, 8-12% per year, for 18-24 months, and possibly substantially longer. Alternatively, inflation could be more acute over a shorter period. By implication, the Fed would have to continue to raise interest rates to counter inflationary pressures, something which has inevitably triggered recessions.

Not all analysts are so pessimistic. Unemployment remains low, and although initial unemployment claims are rising, they are rising slowly and remain at modest levels. Real estate inventory, although rocketing up, remains low by historical standards. In addition, consumer finances remain in comparatively good shape, allowing for a loss of purchasing power due to high gasoline and consumer prices. As a result, many economists anticipate ‘stagflation’, sustained high inflation with mediocre real GDP growth. This is unpleasant but not necessarily a disaster.

There are worse scenarios. The model suggests that monetary accommodation has been so great that the US could see both inflation and recession at the same time. Forget stagflation, the US could suffer a ‘Nor’wester’, an economic gale which blows the trendline down and to the right, pummeling the country with stiff price increases even in the face of declining economic activity driven by interest rate hikes. In fact, this is the outcome predicted by Kalshi, an online marketplace to place bets on economic outcomes. Participants expect a recession in 2022 by a ratio of 82:19, but at the same time anticipate elevated inflation above 8%.

*****

It is hard to overstate just how radical both fiscal and monetary policy have been under the Biden administration. The response to the pandemic was not at all the measured sort seen over the last forty years, or even during the excesses of the late 1960s and 1970s which brought intolerable stagflation at the time. The Federal Reserve and the Biden administration have deployed a scale of fiscal and monetary expansion never before seen in US history during peacetime, not by a substantial margin.

The implications are becoming clear. The fiscal stimulus is wearing off, which could lead to a recession by itself. At the same time, the vast increase in the money supply has begun to manifest itself in consumer price inflation.

It seems likely that the US will experience a technical recession in H1 2022, or barely escape it. After that, consumers will have to reckon with rising interest rates and oil prices unlikely to retreat much for the balance of the year. We would ordinarily expect such developments to lead to a recession starting in the next twelve months or so.

Time will tell. Notwithstanding, it is hard to avoid the sense that the reckoning is upon us.

April Border Encounters: Fewer than it appears

Southwest border encounters, comprising both apprehensions and inadmissibles, hit an all-time record of 231,000 in April, surpassing the previous record set in March 2000.

This aggregate number nevertheless obscures important underlying dynamics.

April apprehensions at the southwest border totaled 201,800, comfortably a record for the month back to 2000. Nevertheless, apprehensions declined during a time of year when we would expect them to rise, even if the drop was a relatively minor 2,000 persons compared to the prior month.

Apprehensions also came in about 10,000 below forecast. Moreover, apprehensions likely include Ukrainians fleeing the war, that is, non-economic migrants. Thus, the underlying apprehensions count may be in the 190,000 range, which would be both an improvement over the prior month and about 10% below our forecast level.

The interesting action this month occurred in inadmissibles, those presenting themselves at official border crossings without appropriate documentation. Inadmissibles soared to nearly 33,000, a number unprecedented in modern times. Virtually all of the growth comes from the 'Other' category, that is, not Mexicans, Guatemalans, Hondurans or Salvadorans. Although Customs and Border Protection does not specify nationality, we can assume that these were principally Ukrainians.

If we remove an estimated 25,000 Ukrainians from the April numbers, then the underlying pace of encounters, including both inadmissibles and apprehensions, probably totaled around 210,000. This is still an extraordinarily high level, but down about 10,000 from March.

Declining apprehensions may not be an unalloyed cause for celebration, however, as border apprehensions are sometimes a leading indicator for the US job market. With the stimulus now unwinding, President Biden expects the federal budget deficit to decline by $1.5 trillion this year, a number already achieved for fiscal year 2022. Such a decline represents 7% of GDP, which would ordinarily be expected to trigger a steep recession. About $400 billion of this might show up in a reduction in net imports, with the remaining $1.1 trillion associated with declining economic activity in the US.

This unwinding may well result in a reversing of certain trends seen during the pandemic. For example, whereas stock outages were common in stores during the pandemic, Walmart and Target both saw soaring inventory levels during Q1, with the former's inventory up a stunning 33%. We may expect to see similar surplus replacing scarcity across the retail space and, by implication, putting downward pressure on prices.

Surplus goods may imply surplus labor. We operate under the assumption that most undocumented immigrants come to the US to work and, moreover, are reasonably well-informed about labor market conditions before they undertake the journey north. With vast numbers of undocumented migrants entering the country since President Biden took office, the supply of unskilled, undocumented labor may be catching up with demand as the market turns. Apprehensions may become subject to trends similar to those witnessed in the retail sector. If that is the case, apprehension levels may decline materially as we head into the back half of the year. That would be good news for the Biden administration heading into the November elections were it not a reflection of distress in the economy. (I would add that President Biden now holds the record for the lowest approval rating at this point in a presidency, worse even than the prior record holder, Donald Trump.)

For now, we can state that the underlying rate of apprehensions declined in April, although it remains at historically high levels. If we are to take a guess about the future, expect apprehensions to trend downward for the balance of the year, possibly materially.

A Better Approach to Russian Oil Sanctions

Current EU efforts seek to impose an embargo on Russian oil and gas exports. This is unlikely to be successful, hurt the EU more than it does Russia (if at all, compared to prior years), cause stress in the anti-Russia coalition and provide no funds to Ukraine.

A better approach is needed, one which sees Russian oil revenues shared with Ukraine.

See the presentation: A Better Approach to Russian Oil Sanctions

March Southwest Border Apprehensions: Appalling, but at forecast

Court filings show that Customs and Border Protection encountered 221,303 illegal immigrants at the US southwest border in March. Encounters include both apprehensions and inadmissibles, the latter being migrants who present themselves at official crossing points without proper documentation. Apprehensions and inadmissibles for March were the second highest on record, with March 2000 slightly higher.

March encounters rose by 56,300 (+34%) over February, but the increase is largely attributable to normal seasonal variations. We forecast 212,300 encounters for March, with actuals 4.2% above the anticipated level. Consequently, March encounters were worse than expected, but not much worse. We are simply seeing a continuation of the Open Borders policy the Biden administration has employed for the last year. Put another way, border apprehensions at the current rate are absolutely appalling, but not a surprise.

Our forecast for a record 2.1 million apprehensions at the southwest border for both fiscal and calendar year 2022 remains unchanged.