April Embargo and Oil Price Cap: More Failure

Russian Oil Production

The EIA published Russian oil production numbers for April, and for a change, they have come in at the EIA's expectations, that is, a decline of 350,000 bpd to 10.51 mbpd, down 7.3% compared to Russia's pre-war production.

​Now, this would appear to be good news, but alas, not everyone believes it.  ​Market Insider reports that, in the four-week stretch to May 5, Russia's "seaborne crude flows reached 3.55 million barrels a day, the highest mark since Bloomberg began tracking the data in early 2022.   The rising seaborne exports continue a trend that was seen throughout March and April."

Given that Russia in February had ostensibly committed to reducing production by 500,000 bpd during March, resurgent exports have prompted skepticism from industry analysts.  Russia has classified or delayed key statistics, including on oil production.  Consequently, booming sea-borne exports of Russian oil and healthy refining volumes at home have prompted questions over whether Russia was indeed cutting its oil production.  Under the circumstances, Russia's Deputy Energy Minister Pavel Sorokin felt compelled to hold a call with Western analysts, trying to convince them that Russia had reduced output as targeted.  Reuters notes that the call was probably the first since early 2022.  If Russians need to arrange a rare analyst call to convince the market that they are not cheating and lying, it is probably safe to assume that they are.

Nevertheless, according to Bloomberg, the number of idled oil wells in Russia rose to 18.1% of the total in March. Perhaps the Russians are cutting production after all, although the US could cut producing wells by 20% -- old stripper wells producing at most a few barrels per day -- without reducing output by more than a few percent.   Time will tell.

Nearly all of Russia's crude exports were sent to China and India over the last month, and volumes to Asia also moved to a new high.  China and India bought about 1.5 million barrels a day, according to Kpler data, and Turkey and Bulgaria were also top buyers.

So much for the embargo.

Oil Prices
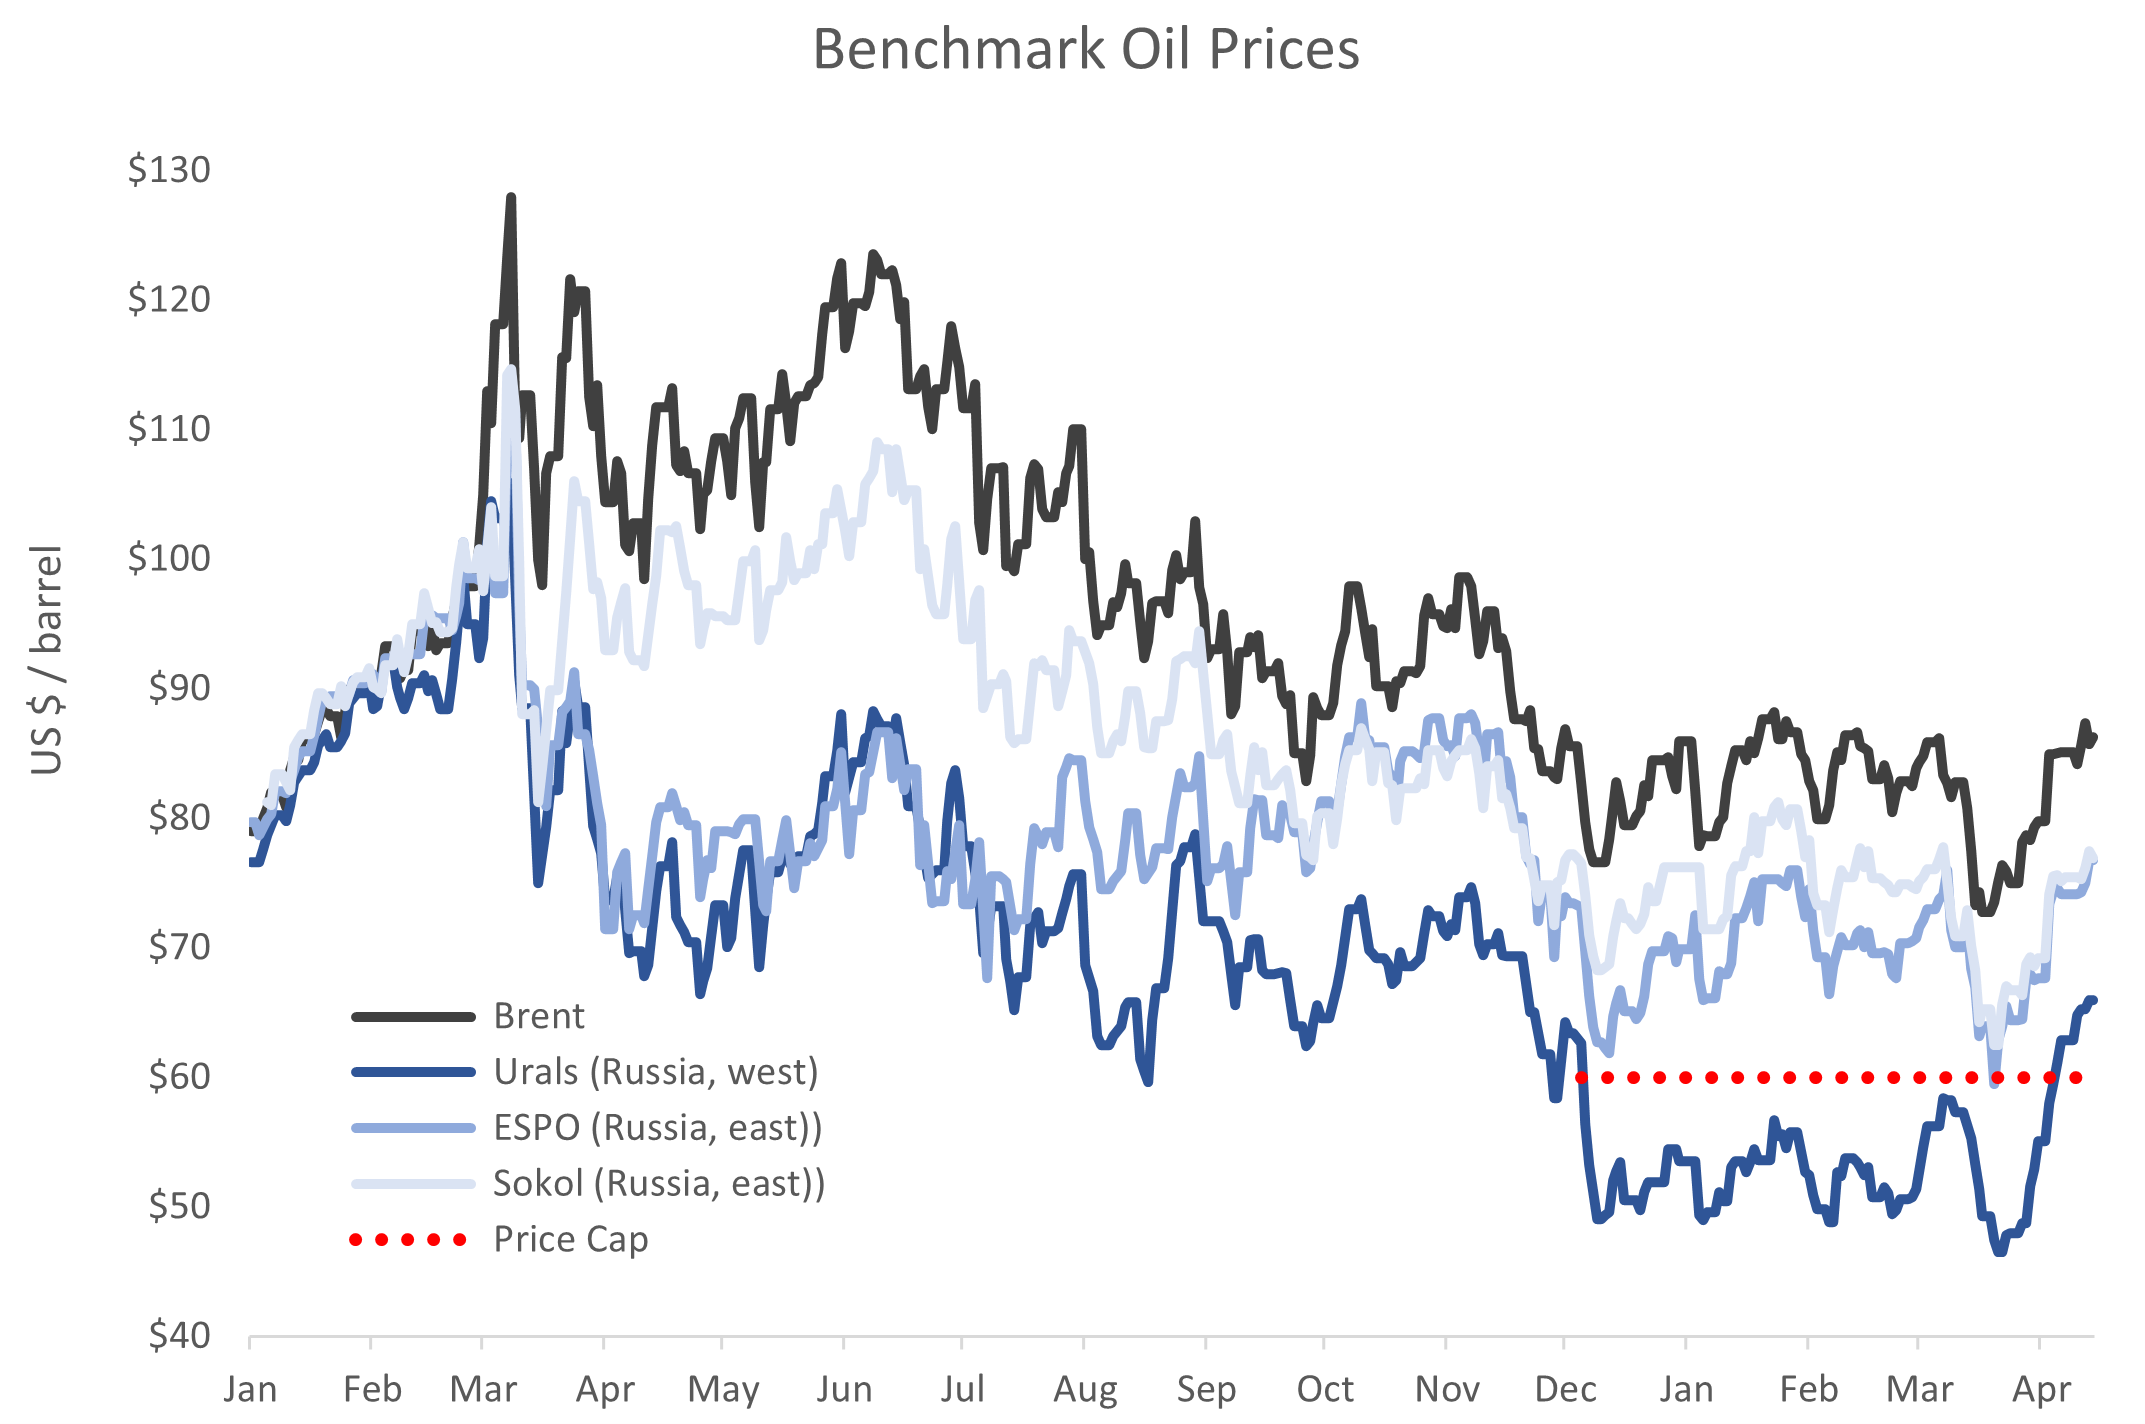
Oil prices have languished in recent weeks, with Brent hovering in the mid-$70s.  This in turn has translated into weaker Russian oil prices since mid-April, with Russia's benchmark Urals price returning below the $60 cap to around $56 / barrel.  

​Nevertheless, ​the Urals Discount -- the difference between the Urals and Brent oil prices -- remains smaller than before the implementation of the Price Cap or the Embargo.  Perhaps the Discount will widen again, but it looks like the Russians have found a way around it.  I would expect the Discount to shrink again, particularly if oil prices strengthen.  

​Overall, both oil pricing and trends in discounts were mildly unfavorable to Russia this week.

Russia's Budget

Oilprice.com notes that the Russian state is starting to accumulate financial reserves again.  Speaking to Bloomberg, Natalia Milchakova, an analyst at Freedom Holding Corp., added that “this may even positively affect the ruble.”

Part of the reason for the recovery of oil revenues to the state budget is a tax hike.  The government's take is based on an officially determined discount for Urals to Brent crude, which was set at $34 / barrel for last month. However, going forward, the base will be a narrowed discount to Brent, reaching $25 per barrel for July.  According to the Russian Finance Ministry, the change in the formula could bring an additional $7.46 billion (600 billion rubles) into the federal budget.  As a result, Moscow will likely begin buying foreign currency for its sovereign wealth fund again, with analysts expecting the purchases to begin in June and focus on the Chinese yuan.

In other words, continued elevated volumes of oil production, a trend towards a closing Urals discount, and a higher tax rate may allow Moscow to once again run a 'profit' on the war, in the sense of being able to accumulate, rather than draw, reserves.

So much for the Price Cap.

Conclusion

We have stated, for more than a year, that the Embargo and Price Cap would be failures, and the incoming data are consistent with our views.  Given that former President Trump on CNN called for a reduced commitment to Ukraine were he to be re-elected, it is high time for the Ukrainians to take a more proactive role in the matter of Russia's oil export revenues.

EIA PSR Week of April 28: Panic at the Disco

  • Crude inventories declined again this week

    • Excess crude inventories, as measured by seasonally-adjusted days of turnover, have fallen by 39 mb since early March, now only 13 mb

  • Product inventories are normal

    • Crude and key product inventories, taken together, are up 7 mb to 10 mb this week, as measured by seasonally-adjusted days of turnover terms.

  • SPR draws continue at 290 kbpd this past week.  Why?

  • Refined products supplied was softer this week, with gasoline down but diesel holding up

    • There is still no recessionary signal in the US data today, although this week’s consumption (supplied) data was a bit light

  • US crude and condensate production rose by 0.1 mbpd to 12.3 mbpd, materially unchanged in the last ten months

  • Oil prices have tanked

    • This is pure financial panic

    • The futures curve continues to signal normal balances going forward

    • Panics can resolve organically. Or they can be a harbinger of a pending financial crisis.  Take your pick.

DOE Week of April 21st: Oddly weak oil prices

  • Crude inventories declined this week

    • Excess crude inventories, as measured by seasonally-adjusted days of turnover, have fallen by 26 mb since early March, now only 16 mb

  • Product inventories are normal

  • Crude and key product inventories, taken together, have fallen by 30 mb since early March as measured by seasonally-adjusted days of turnover, and now stand at only 3 mb, which is effectively nothing in practical terms.

  • SPR draws continue at a pace of 150 kbpd this past week

  • Total, diesel, gasoline, and jet fuel supplied (consumption) all look good by recent comparisons, particularly jet fuel and diesel (distillate)

    • There is no recessionary signal in the US data today

  • US crude and condensate production fell by 0.1 mbpd to 12.2 mbpd, materially unchanged in the last ten months

  • Oil prices have fallen back despite OPEC production cuts

    • Oil prices have a distinct recessionary feel.  Flat US oil production, OPEC production cuts, solid US oil demand and ostensibly recovering Chinese demand should be notably bullish for oil prices

    • Clearly, this is not the case and suggests weakness either in the financial demand for oil futures or weak physical demand for crude oil

    • Notwithstanding, our incentive to store analysis continues to show normal supply/demand balances for crude oil into the second half of the year, which should be constructive for oil prices

    • Perhaps tepid pricing is merely a passing blip, but it could also represent a financial crisis in the works or a Chinese economy not as strong as commonly thought

The Oil Price Cap: Continued Collapse of the Discount

Last time, I noted that the Urals oil price had breached the $60 / barrel price cap, and moreover, that the Urals discount was shrinking.  The situation has deteriorated further over the last week.

Let's start with oil prices.  Brent eased back a bit this week to the range it has been holding for most of the year.  On Friday it closed at $81.66. Not much news here, save that OPEC's production cuts have not produced visible results to date.

​On the other hand, the Urals oil price, the price Russia receives for its crude oil exports to the country’s west, has settled in the mid-$60s, latest at $65.44 / barrel. This is well above the $60 / barrel price cap dictated by the western powers.  Thus, Russia has not only broken through the cap limit, but also sustained the Urals price above the cap level.

The news on the Urals discount is substantially worse.  As readers will recall, the Urals discount is the difference between the Brent oil price, the benchmark for Europe; and the Urals price, the benchmark for Russian western crude exports.  This discount is closing with screaming speed, now only $16 / barrel, the smallest since the start of the war.  The Oil Price Cap is not only failing, it is failing spectacularly.  

Meanwhile, efforts are beginning to try to salvage the program.  The Poles want stricter enforcement of the Price Cap, and Bloomberg reports that a tanker company, Gatik Ship Management, had "lost industry standard insurance for its fleet after falling foul of a Group of Seven price cap".  Gatik is a shadowy company with nominal headquarters in Mumbai, India.  Bloomberg elaborates:

Gatik is one of a handful of tanker companies that sprang up out of nowhere when the west began ratcheting up sanctions on Moscow last year.  When Bloomberg visited the address earlier this year, a person from a neighboring office said Gatik had moved out and there was mail strewn on the floor outside. There is no website, phone number, or other means of contacting the firm.

The company operates a fleet of 48 Aframax tankers, the type used for Russia crude exports.  

So what happens next?  Well, it is reasonably safe to assume that Gatik's vessels will be sold or otherwise transferred to a new, similarly shadowy company, which we may call Gatique (no relation!) with headquarters, say, two blocks from Gatik.  This new company will obtain maritime insurance, and after a few months will be deemed in violation of the Price Cap, after which the vessels will be sold to a company which we may call Batik, and so on.  

Prohibitions, price caps and resulting black markets inevitably devolve into games of Whac-A-Mole (here, for my Ukrainian readers).  The only surprise is the unending naivete of the US Treasury, which, again according to Bloomberg, "warned that some oil tankers shipping Russian crude in Asia are using deceptive tactics to evade the Washington-led price cap on the country’s exports."  Goodness, who knew?

If you were a Ukrainian policy-maker, you might assume that the system should be self-correcting, that the US government would eventually modify the Price Cap incorporating black market theory. Not at all. The history of prohibitions shows only two government responses, either tacit acceptance of black markets or doubling down on enforcement. Neither produces good results, and both represent a material threat to Ukraine, particularly in the post-war world.

If the Ukrainians fail to ask for a change, the current Oil Price Cap will continue in some form indefinitely, an on-going game of Whac-a-Mole, sometimes bringing a rush of enforcement and, at others, feigned ignorance and tacit acceptance of Russian oil smuggling. Both approaches will fail, just as the current Price Cap is failing.

All this is likely to continue until the Ukrainians stand up and request a better system. Unfortunately, the Ukrainians are mired in passivity. The Ukrainian Embassy in DC has had our exposition on the topic for an entire year now, and they have done exactly nothing with it.  The sooner the Ukrainians wake up and take responsibility for the success of Russian oil sanctions, the sooner the matter will be addressed to Kyiv’s satisfaction.

Rigs and Spreads Apr. 21: DUCs continue to decline

  • Rigs counts gained

    • Total oil rig counts rose for a change, +3 to 591, but are still below their level of last June

    • Horizontal oil rig counts were +3 at 543, no higher than last July

    • The Permian horizontal oil rig count was up 4

  • The pace of horizontal rig additions rose to -0.75 / week on a 4 wma basis.  

    • This number has been negative for 18 of the last 19 weeks

  • Our model suggests continued falls in the 1 / week range

  • Frac spreads were +7 to 290, but at about the same level as last May

  • Highlights from the April DPR report

    • DUCs: Earlier issues of the DPR showed small gains in the DUC inventory.  The current report shows declines instead, with continuous erosion in DUC counts since June 2020, albeit at the slow pace of 6 / week currently

      • At current estimated rig and spread productivity levels, we would expect the DUC inventory to continue to decline modestly

    • Crude and condensate production from key shale plays rose to 9.03 mbpd in March, up 80 kbpd from February, with shale oil output looking to set new all-time highs next month

      • Total shale oil production growth has averaged 42 kbpd / month over the last four months

    • Permian production was up 31 kbpd in March.  

      • Permian production growth has averaged 22 kbpd / month over the last four months

  • Overall, not too much change in the data, but for all that, production growth from key shale plays remains respectable according to the latest DPR.

Rigs and Spreads Apr. 21,pdf

More on March Border Apprehensions

After my prior post on March apprehensions, my friends at the Center for Immigration Studies reminded me that I was, in fact, overstating the improvement in southwest border apprehensions. 

In January, Customs and Border Protection implemented CBP One, which allows up to 30,000 Venezuelans, Haitians, Nicaraguans and Cubans to be admitted each month.  For an apples-to-apples comparison, CBP One entrants should be added to border apprehension totals, which would make the apparent improvement somewhat less impressive.

Mark Krikorian, Executive Director of the Center for Immigration Studies, details the problems with CBP One in a New York Post op-ed:

[CBP One] did, in fact, cause a drop in illegal crossings for a couple months, as prospective illegal immigrants adopted a wait-and-see approach. [This] made sense initially, because 99% of would-be illegal immigrants who got an appointment through CBP One ended up being let in and let go.  The problem is that CBP One doesn’t work especially well, and the number of slots it gives out each day is limited in any case — it’s almost a lottery as to whether you’ll get the OK.  This has led increasing numbers of people, lured to the US border by Biden’s rhetoric and policies, to skip the CBP One process and just jump the border as before.

Krikorian’s critique again highlights the inherent limitations of using a quantity-based approach.  If the price of the visa is set to near zero, then visa demand will vastly outstrip supply.  Consider: The effective minimum wage in the US right now is about $15 / hour or $30,000 / year.  Globally, 8.1 billion people live in countries with a per capita GDP below $30,000.   US minimum wage can seem quite low, but for many billions of people, it would be a big step up.  Therefore, any quantity-based approach like CBP One or the H2 visa programs will stock out immediately, leaving vast, residual demand.  The overwhelming majority of would-be applicants who fail to make it into the program are incentivized to attempt illegal entry.

To close the border, we need a price-based approach, which involves the on-demand availability of visas at a market price.  This circumvents the CBP One problem by allowing prompt access to visas by any qualified applicant at a price set by the applicants themselves for a given level of supply.  The visa price should be equal to the expected present value of illegal entry.  In other words, the migrant will decide whether to enter illegally or pay the visa price.  If illegal entry is better, then the visa price will fall to the market-clearing level and the border should close again.  Of course, the visa volumes need to be somewhere in the vicinity of underlying US business demand.  To provide some indicative numbers: my current estimate of the value of a migrant work visa is about $12,000 / year, and the necessary number of visas, given a hot US labor market, may be on the order of one million.  

Of course, this pushes the enforcement issue into the US interior.  The visa value, $12,000 / year, is about three times the annual income of an unskilled Guatemalan. Keeping migrants legal once they enter is the hard part, of which I have written at other times.

In any event, if we accept Krikorian's line of reasoning, that the CBP One program is failing and that migrants will resume illegal entry to earlier levels, then, of course, our annual apprehensions forecast will have to be revised upward.  Let's see what the data brings.

March Southwest Border Apprehensions: Still high; and a budding Chinese refugee crisis?

US Customs and Border Protection reported 162,317 apprehensions at the southwest border for the month of March.  This reflects normal seasonal gains given the new set of policies instituted by the Biden administration in January.  March apprehensions were the 5th highest for the month in the last quarter century, with the Biden administration holding three of the top five spots.  March apprehensions were still running more than three times the average for the month during the Obama and Trump administrations.  In other words, the situation has improved but remains dreadful.

With the change of administration policy, our forecast for the year also changes.  Our prior forecast anticipated 2.7 million southwest border apprehensions for fiscal year 2023.  This is reduced to 2.0 million, which is much better.  On the other hand, our forecast for FY 2023 apprehensions still constitutes the second worst year on record, better than only last year.  So again, a big improvement, but still dreadful.  

The composition of apprehensions is quite interesting.  A substantial share of the growth in apprehensions arose from non-traditional sources, that is, outside Mexico and Central America (MCA).  Apprehensions of 'Other' (non-MCA) nationals soared from 4,000 per month before the Biden administration to a staggering 156,000 this past December.  Apprehensions of 'Other' nationals remain elevated at just under 60,000 for March.  Again, we see enormous progress, a decline of 100,000 / month, but on the other hand, 'Other' apprehensions continue to run at 15 times the normal level. 

Apprehensions of nationals from Mexico and Central America have declined by 20% compared to last March, but remain at roughly three times normal levels.

While apprehensions are showing improvement, inadmissibles continue to run hot.  Inadmissibles, those presenting themselves at official crossing points without appropriate documentation, were reported at 29,582 for the month of March.  This is both nearly three times the level of last year and a record since 2012 by a similar margin.  The data continues to speak to extraordinarily permissive conditions at official crossing points.

Finally, the Wall Street Journal reports a spike in the apprehensions of Chinese nationals at the southwest border.  While the absolute numbers remain small, the pace of growth is stunning, speaking to a rapidly deteriorating political environment in China.

Russian Oil Production: A Full Recovery in Sight

The Kyiv Post ran my piece from last week as an op-ed: The US, Ukraine and Trust .  Thank you, Bohdan.  Perhaps it will help gain a bit of traction with Ukrainian officialdom.  

Let me start by returning to my previous post on the Urals oil price, which has broken through the $60 cap.  Several readers pointed me to an analysis in Axios, The price cap on Russian oil seems to be working.  The Axios article covers the period through March.  The Urals price breakout occurred only in April, briefly a couple of weeks ago and more visibly this past week.  This period is not covered in the Axios piece.  Having said that, there are any number of problems with Price Cap even as described by Axios, chief among them that the Ukrainians have left about $50 bn on the table in the last year, enough to offset US Ukraine-related expenses by perhaps two-thirds or sufficient to buy 100 F-16s every two weeks.  This is a big deal and it will become a very, very big deal.  That's one takeaway from the Urals price breakout.

Russian Oil Production

Russian oil production continues to run ahead of the forecasts of the EIA, the US Energy Information Administration, the statistics arm of the US Department of Energy.  The EIA estimates Russian oil production at 10.83 mbpd for the month of March.  This is 0.3 mbpd below the prior month and 0.9 mbpd (4.4%) below Russia's pre-war output.  Russian oil production is declining, but not much, and in March was running a whopping 1.3 mbpd above the EIA's January forecast.

Further, on Friday, CNN reported that Russian oil exports have regained pre-war levels.  Yahoo Finance chimes in, noting that China and India are buying so much Russian oil that Moscow's now selling more crude than it was before invading Ukraine.

Given the Urals price breakout and the resumption of normal oil exports from Russia, the EIA's expectations for further reductions in Russian oil production are likely to be thwarted.  Indeed, I would not be surprised if Russia's oil production started to move closer to the Black Market Forecast which I made last July and can be seen on the graph below.

The EIA's substantial forecasting miss arises from the same source as the failure of the Price Cap: a lack of black market economic models.  (Indeed, this is the same issue DHS and the Bipartisan Policy Center face with illegal immigration, which is functionally the same problem.)  This is our unique field of expertise. 

Russia has broken through the Oil Price Cap

Russia has managed to break through the Oil Price Cap, with the weekly, average Urals oil price rising to $66 / barrel versus a cap of $60.

Not only is the Urals price above the cap level, it is also $10 / barrel above the average Urals price for the seven years prior to the start of the Ukrainian war.  

The collapse of the Price Cap is also evident in the Urals discount, the difference between the Brent and Urals oil prices.  Historically, the Urals oil price has averaged about $1.50 / barrel less than Brent.  This gap widened to more than $35 / barrel in the early days of the war, but narrowed to around $23 / barrel last fall.  The Price Cap re-opened the gap to near $30 / barrel.  In the last two weeks, however, the gap has once again closed, now back to $20 / barrel, the smallest since early September.

I have criticized the price cap and the EU embargo as the wrong policy from the start -- a year ago now.  I have not changed my view.

EIA PSR Week of April 7: Peak oil (again), and "What Recession?"

  • Crude inventories were flat this week

  • However, excess crude inventories, as measured by seasonally-adjusted days of turnover, have fallen by 14 mb since early March

  • The administration has resumed draws from the SPR.  What's the logic of that?

  • Product inventories are normal

    • Crude and key product inventories, taken together, have fallen by 22 mb since early March as measured by seasonally-adjusted days of turnover, and now stand at only 12 mb, which is effectively nothing in practical terms.

  • Total, gasoline, and jet fuel supplied (consumption) all look good by recent comparisons, particularly jet fuel

    • If the US is heading into recession, it is not apparent in the oil consumption data, where we would expect to see it

  • US crude and condensate production rose by 0.1 mbpd to 12.3 mbpd, materially unchanged in the last ten months

    • The EIA sees US crude and condensate production flat through Q3, rising modestly in 2024

    • This seems rather optimistic, given that US rig counts have been declining for 17 of the last 18 weeks.  If rig counts are down and spread counts are flat, where is US production growth coming from?

    • Indeed, the EIA's April STEO sees February US crude and condensate production as the high point through Q3.  Given the EIA's flat oil price forecast, the impetus for higher rig and spread counts appears to be lacking.  As a result, for the moment, it looks like February 2023 crude and condensate production may be penciled in as the US peak (excluding NGLs) for this cycle.

  • Oil prices have risen sharply on OPEC production cuts.  

    • The futures curve is now in more decided backwardation, and storage incentive analysis suggests the traders expect oil markets to be largely in balance for the rest of the year, that is, current pricing looks sustainable

The US, Ukraine and Trust

Recently leaked intelligence papers suggest that the US is spying on world leaders, including US allies.  This is no doubt true, and it's certainly nothing new.  The very nature of NSA surveillance techniques, which involves culling trillions of bytes of data from every imaginable communications source, by definition will monitor the phones and internet traffic of foreign leaders, and pretty much everyone else.  That means the US spies on Ukraine, too.

And it's probably a good thing.  

One of the interesting cultural differences I observed in Eastern Europe revolves around manager-subordinate relations.  In the US, if a superior asks a question of a subordinate, answering, "I don't know," or "I'm not sure," is okay.  Expressing doubts about an initiative is not only acceptable, but often required.  The manager is trying to ascertain what is known and unknown, and as a manager myself, I wanted the story straight up.  This kind of interaction comes directly from the liberal arts tradition, where inquiry, uncertainty and an exchange of ideas is encouraged.  A topic can be discussed irrespective of the status of the participants.  

That is not the system in Eastern Europe.  Students tend to be taught rote, and they are expected to know the 'right' answer.  Failure to do so draws a demerit.  Subordinates therefore feel under pressure to yield the 'proper' answer, resulting in claims of competence, knowledge or expertise which they may lack.  Consequently, an American manager will regularly be surprised by Eastern European subordinates who bite off more than they can chew and fail to deliver.  This in turn leads to delays and greater problems down the line.

This sounds a bit like the information, or rather the lack of it, coming out of Kyiv regarding Ukraine's combat capabilities.  We know much more about Russian personnel, tank, aircraft and artillery losses than we know about Ukraine's.  This leads to unwelcome surprises, for example, seeing Ukraine cede ground where we might expect it to be winning.  Part of that arises from Kyiv's culturally conditioned fear of divulging bad news, of giving the ‘wrong’ answer.

On the other hand, just because you're paranoid doesn't mean that they are not out to get you.  US support for Ukraine is ultimately political.  Kyiv has to keep the US public on board and may feel a need to paint a rosier picture than the reality on the ground.  Further, the hard right wing of the Republican Party wants to cut Kyiv loose, and President Biden remains hesitant about pursuing victory over Russia.  No less than Ben Hodges, former commanding general of U.S. Army Europe, has excoriated the Biden administration for this waffling:

"Just say, 'we want Ukraine to win.' Instead, what we hear from very good, smart, hardworking senior officials [is], 'we want Ukraine to be in the best, in the strongest possible position so that when they go to the negotiating table, they're in a good, strong position.'"

What trust should Kyiv lend the US under the circumstances?  The Ukrainians are fighting for their lives, and the Biden administration is playing for a tie.  Does that foster open, full and frank communications?  Or does it open the door to another Afghanistan-style disaster in 2024 as the Ukraine slowly runs out of men?

I always try to close my posts with some interesting insight.  Here I struggle.  Trust is important.  That's cliche.  The partners should trust each other.  Well, the partners' objectives are not quite aligned.  Moreover, the Ukrainians are a bit unsophisticated, and the US president vacillates.  Maybe the US and Ukraine should not trust each other entirely. In such a world, spying can have an upside, because it can deliver bad news on the sly and allow US planners to adjust military support more rapidly.  At the same time, Kyiv cannot afford to fully trust US leadership and be a passive consumer of US policy.  The Ukrainians need to be able to think for themselves, and outside the military sphere, they remain subpar in this regard by a substantial margin.

Finally, President Biden's legacy still rests on victory in Ukraine.  Two days after the start of the war, I wrote The Democrats will be buried in the Ashes of  Kyiv, in which I argued that the Biden administration will own any loss in Ukraine.  That's also true for a 'tie' which allows Russia to retain any of its gains.  Moreover, the administration has to see Ukraine win the war within the next sixteen months if it wants credit at the polls next November, and that includes any possible recession between now and then.  For the Biden administration, playing for a tie is fraught with risk and likely a political loser.

The administration would do better to commit to victory.  With it, the Ukrainians will trust us more.  This can lead to victory in the field, which should ensure President Biden's re-election in 2024.  

Perhaps that's the lesson for today.  Commitment creates trust, and trust is political capital in the long run.

Rigs and Spreads Apr. 7: Declines within overall stagnation

  • Rigs counts fell again

  • Total oil rig counts fell, -2 to 590

  • Horizontal oil rig counts were -3 at 542

  • The Permian horizontal oil count was flat.

  • The pace of horizontal rig additions fell to -2.25 / week on a 4 wma basis.  

    • This number has been negative for 17 of the last 18 weeks

    • Rigs counts have been falling at a pace of 2.5 / week for the last couple of months, and our model suggests continued falls in the 1-2 / week range

  • Frac spreads were -8 to 287

  • At current estimated rig and spread productivity levels, we would expect the DUC inventory down over the coming month

  • The overall picture is one of stagnation, in rig and spread counts, DUC inventory, and in US crude and condensate production

M2 Velocity: A Polarized Outlook

The path of US inflation depends in large part on the outlook for the velocity of money (M2).

The velocity of money is defined as GDP divided by the money supply, M2 in this case. In colloquial terms, it measures the number of times money turns in the economy every year. From 1960 until 1990, the velocity of money (M2) was broadly stable around 1.8 times per year.

This accelerated to 2.2 times during the Clinton administration, but began a long decline after 2000. Velocity stabilized a few times in the intervening years, but resumed its decline eventually.

From 2017 until the start of the pandemic, velocity appears to have stabilized around 1.45 turns per year.

Velocity collapsed with the pandemic, with the great slug of stimulus staying on the sidelines initially and thereby collapsing velocity. In the last year, however, velocity has begun to increase, and on current trends, might be expected to regain pre-pandemic levels by the second half of 2024.

Were this to occur, and were monetary policy neutral (that is, growing at the same pace as GDP), the we might expect a few pretty hot quarters of inflation in mid-2023, as high as 9% for a quarter or two. However, if the Fed continues to reduce M2 at the pace of the last five months, assuming no recession, inflation would come in around 6.5% per the model for the next few quarters, but return to normal levels by 2024.

Source: FRED M2V

Alternatively, the velocity of M2 could resume its long-term decline. In such an event, the US would be on the cusp of deflation of about 3.3% / year, almost 6% allowing for a continued reduction of the money supply (M2) at the pace of the last five months.

These are two highly polarized outcomes, one with an inflation surge and another promising a bout of brutal deflation, almost certainly accompanied by a stiff recession.

It’s difficult to know how to choose between these two eventualities, and I could make a case for either.

However, if we look to the precedent of the Spanish Flu of 1918, then a clear preference emerges. Deflation is on the horizon. The US suffered a short but sharp downturn known as the Depression of 1920/1921, that is, three years after the start of the flu. During this downturn, GDP is estimated to have fallen by 2.4 % to 6.9% and prices declined by 13% to 18%, depending on the study.

It would be comforting to think we could avoid the mistakes of history, but the cynic in me is inclined to think that we will prove no smarter than we were a century ago.

Russia Jan-Feb Deficit running at 10% of GDP

Jan-Feb figures from the Russian Ministry of Finance indicate that the Russian federal budget is running a deficit at the pace of 10% of GDP.

This is a relative improvement over January, when the annualized deficit was running at the pace of 13.7% of GDP. However, it is consistent with the numbers since Q3 2022, when our analysis showed the Russian budget in a deficit of 10% of GDP, as now.

On the revenue side, the chief culprits is oil and gas revenues, down 46% compared to the same period last year. Meanwhile, expenses related to state procurement, including the funding of the war, are up 52% compared to Jan.-Feb. last year. The result is a large deficit, compared to a modest surplus last year. Anecdotal information, notably reports of delayed, partial and missing payments to Russian soldiers in Ukraine, are consistent with a shortage of cash in Kremlin’s coffers.

This current deficit is large, but not unexpected for a country in the middle of a major war and struggling with associated sanctions.

As before, Russia may be expected to cover most of the deficit by draws from its sovereign wealth fund, which should see it through 2023.

Understanding the Bank Run

I know bank runs.

In 1998, I was Director for Financial Advisory Services (FAS) for Deloitte & Touche in Budapest.  FAS was the investment banking arm of Deloitte, and I had been chosen to lead the privatization of Hungary's second largest bank, Postabank.  It was run by Gábor Princz, a short, squat man with a bad reputation.

Most Americans are not familiar with postal banks, but many European countries have them.  These allow members of the public to deposit and withdraw cash at their local post office, handy for a country with thin banking coverage.  As a result, postal banks are the most retail of all retail banks, true widows-and-orphans institutions, the place Hungarian retirees would go to collect their meager pensions in cash. 

Postabank should have been a boring bank, but this was post-communist Hungary.   One could hear on the street that "Postabank stands behind" such and such an entrepreneur. This would be truly bizarre posture for a commercial bank.  You will never hear, for example, "Bank of America stands behind the Stop-'n-Shop."  However, we might instead expect to hear that from a private equity or hedge fund.  And that's exactly what Princz had done with Postabank: transformed it into his own personal hedge fund. Princz used Postabank to bankroll any number of dodgy characters, many of them with better political connections than business expertise.

As was the case with everything in Budapest, this was widely known and a cause for concern.  The Socialist government of Gyula Horn was keen to privatize the bank.  The problem was, however, that none of the Big Four accounting firms was willing to sign off on the bank’s audit.  Well, none except Deloitte & Touche.   Some senior partners at Deloitte had historical ties to the Socialist Party from way back in the socialist days. (There is a direct line from this to Russia's capture of Hungary's foreign policy, by the way.)  Over howls of protest from the auditors, Deloitte certified Postabank's books.  No doubt purely by coincidence, Deloitte was promptly awarded the mandate to privatize the bank.

I was chosen to be the privatization lead.

A week or two later, at 10 am on February 28th of 1998, I was at my desk when I saw a murmuring among my Hungarian staff, flurries of emails, and hushed phone calls.  I naturally asked what was going on, to be told that Postabank was rumored to be failing and depositors were queuing to get their money out.  By noon, it was all over.  The bank had failed.  In that two-hour stretch, Hungary had lost more than 1% of its GDP.  

This colorful, if disastrous, story from post-communist Hungary is a tale of a classic bank run, of depositors -- panicked that bank management had lent their money to shady or uncreditworthy borrowers -- stampeding to withdraw their money.  

This is not the story of SVB.

No one has accused SVB of reckless loans to bad clients.  SVB did not and does not have a non-performing loan problem.  Indeed, half of its deposits were invested in US government treasuries and agency-backed (government guaranteed) mortgage securities.  Lending money does not get safer than that, and indeed, Investopedia notes that "the interest rate on a three-month U.S. Treasury bill (T-bill) is often used as the risk-free rate for U.S.-based investors."   To all appearances, SVB set conservative lending standards.

So why the run on SVB?

It is a story of bad management, not at the commercial banks, but rather at the US Federal Reserve Bank and Treasury.  The most important error was one of construction.  The Fed believed that the pandemic downturn was the equivalent of the Great Recession and required a ‘go big’ policy. As Fed Chairman Jerome Powell saw it in October 2020:

"Too little support would lead to a weak recovery, creating unnecessary hardship for households and businesses. Over time, household insolvencies and business bankruptcies would rise, harming the productive capacity of the economy, and holding back wage growth. By contrast, the risks of overdoing it seem, for now, to be smaller. Even if policy actions ultimately prove to be greater than needed, they will not go to waste."

This view underpinned the Treasury’s decision to push the Federal Funds Rate (FFR) effectively to zero. 

Only twice in the prior century had this happened, during the Great Depression and the Great Recession, with the FFR held at zero not for a few months, but for seven years at a time.  Because both qualified as depressions, zero interest rates had virtually no effect on either asset prices or inflation.  In the Great Recession, for example, home prices did not regain their 2006 peak until 2017.  

But the pandemic was not a depression, but a suppression.  This is the difference between Jimmy getting the flu and Jimmy being grounded.  The economy was not sick during the pandemic, it was locked down.  Imagine that the parents ground Jimmy and say, "Stay in your room, but here's $2,000 in spending money."  It's clear that Jimmy would be in a mood to spend when conditions permitted.  In the meanwhile, Jimmy contemplated what to do with easy money, and went out and invested in real estate and stocks. From Jan. 2020 to June 2022, house prices increased nationally by 45%, and this during a period when a chunk of the economy was shut down.  Stocks similarly benefitted, with the S&P 500 doubling in value.  But this was nothing compared to the tech stocks.  Tesla's valuation, for example, increased 25-fold in less than one year.   Unlike the Great Recession, zero interest rates exploded house and tech company valuations.  This happened because the Fed and Treasury misunderstood the essential nature of the downturn.  It was not a depression, and not even a recession by traditional metrics, as the economy bottomed in less than one quarter.  It was a suppression, an external force -- covid and resulting lockdowns -- preventing the economy from operating.  By mistaking the nature of the downturn, the Fed and Treasury vastly overstimulated the economy.  

For SVB, this would prove the perfect storm.  Soaring valuations led tech companies to raise capital and deposit the money in, well, Silicon Valley Bank.  SVB's deposits quadrupled during the pandemic.  But how should SVB invest the funds?  Given rock bottom interest rates, SVB took a conservative approach and invested half of its funds in 3-month treasuries and mortgages guaranteed by the US government.  SVB did not make unusually bad loans. No one has suggested that they did. 

So what happened?

As it turns out, the action is all on the liabilities -- customer cash deposits -- side.  As readers will recall, US Treasury Secretary Yellen and Fed Chair Powell assured the public as late as mid-2021 that inflation was 'transitory'.  This faith was based on a rejection of the Quantity Theory of Money (QTM), which holds that the price level is a function of the quantity of money in the economy.  This concept is best captured by the famous quote from the Nobel Laureate economist Milton Friedman, who said, “Inflation is always and everywhere a monetary phenomenon, in the sense that it is and can be produced only by a more rapid increase in the quantity of money than in output.”  Alas, Friedman’s view had fallen out of fashion, most notably at the Treasury and Fed, giving Powell and Yellen the confidence to blow out the money supply by nearly 40%. 

QTM would have cautioned that the price level should rise by near 40%, that is, that the US should experience inflation summing to 40% (less real GDP growth) over a period of, say, 2-4 years.  Not so, said Yellen and Powell.  At worst, inflation would be transitory.

This notion was not entirely unfounded.  From late 2007 to just before the pandemic, increases in the money supply should have generated a cumulative 60% increase in prices.  Instead, over those twelve years, the US saw only 20% inflation in total.  However, that period saw the Great Recession (really a depression), as well as the rise of China and aging demographics in the US, with all this playing out over more than a decade.  

By contrast, the Fed injected a massive amount of liquidity into the economy in 2020, with the resulting dynamics closer to those of the 1970s oil shocks.  But even here the comparison is qualified.  The second biggest injection of liquidity in the last sixty years came in 1971-1972.  During a two-year period, the money supply grew enough to imply a 14% rise in prices.  By contrast, in 2020, the Fed injected liquidity three times the 1971 precedent -- and all in one quarter!  It is hard to overstate just how aggressive monetary and fiscal stimulus was during the pandemic.  The result was persistently high inflation, leading to a change of heart at the Fed.

Figure 1

Source: FRED M2SL, GDP, GDPC1, CPI, Princeton Policy analysis

Early last year, the Federal Reserve determined that reducing inflation would require raising interest rates after all, which began in earnest in Q2 2022.  By July, it was apparent that the Fed would follow the so-called Taylor Rule or a variant to bring down inflation.  A number of economists analyzed the implications, one version of which, labelled “P&P Balanced Approach”, can be seen on the graph below.  This suggested that the interest rate on the 3-month treasury bill would reach 4% by year-end 2022 and 4.4% in the first quarter of this year, and so it proved.  

Figure 2

Source: Federal Reserve 2022 Stress Test Scenarios, 2023 Stress Test Scenarios; David Papell and Ruxandra Prodan, “The Fed Fell Behind the Curve by Not Following its Own Policy Rules” in Econbrowser (July 2022); KPMG Insights on Inflation; CNBC

Nevertheless, the Fed never subjected the banks to a stress test at anywhere near this level in 2022.  The highest level the Fed tested was 0.7%, not the 4.0% which proved to be the case.  Indeed, the Fed was testing at 0.5% at mid-year when the 3-month rate was already at 2.7%.  

If the Fed was failing miserably in its mission, the banks were most certainly not.  The finance department of any bank will run profit and loss numbers weekly, if not daily.  They are all familiar with the Taylor Rule and were well aware, by mid-year, of the likely path of interest rates going forward.  They must have been alarmed, because these same banks had issued a tsunami of mortgages around 3% interest rates in the orgy of lending from Q1 2020 to early 2022.  If the cost of deposits rose to 4.5%, and the banks were earning 3% on mortgages, they would be structurally loss-making, with virtually no prospect of escape.  I can only imagine that this was brought to the attention of Secretary Yellen and Chairman Powell not once, but a dozen times, from July onward -- including from the Fed's and Treasury's own analysts.

And this brings us full circle to SVB. The graph below shows the underlying reality of SVB and other commercial banks.  From May 2022, the Treasury rate began to climb, rapidly pulling away from bank interest-bearing deposits like savings and money market accounts.  As of this past week, banks were paying on average 0.54% interest on existing deposits even as treasuries were offering 4% (pp) more.  In a bank like SVB, one with sophisticated corporate clients, depositors will begin to remove the funds from the bank and invest them in much higher paying treasuries.  Of course, the bank could offer higher interest rates, and most offer around 4% on new savings accounts today.   But this hardly helps, and may hurt.  Many retail clients may not appreciate just how low their interest rate is.  Therefore, raising the interest rate will eventually raise it even for clients who are willing to accept a lower rate.  Consequently, raising deposit rates may actually make the bank worse off than allowing some portion of existing clients to remove their funds. 

In the case of SVB, the rapid rise in interest rates led to a kind of structural run on deposits.  As the bank was unable to offer competitive terms, depositors removed their money.  This forced SVB to sell its assets, those treasuries and agency-backed mortgages, to pay for redemptions.  Of course, with the dramatic rise in interest rates, these assets could only be sold at a loss.  When the asset liquidation started, SVB's clients lost faith in the bank and triggered a more traditional, panic-driven run.  

There is nothing particularly special about SVB, regardless of what you might read.  It was more exposed than other banks due to its affiliation with the tech industry.  Nevertheless, the regional banks, those who make a living issuing mortgages to homeowners in their communities, are similarly at risk.  For this reason, the Mid-Size Bank Coalition of America, which represents more than 100 lenders, called on the Federal Deposit Insurance Corporation to put backstops in place and broaden its protection for smaller banks.  A group of economists underscored the risk, noting that “almost 190 banks are at a potential risk of impairment to insured depositors.” Nor is that the upper limit, as the study authors further caution that, “if uninsured deposit withdrawals cause even small fire sales, substantially more banks are at risk.”

*****

Any number of articles in the media have impugned the integrity of bank management, notably at SVB.  Even more are calling for ever stricter regulation.  

The current crisis is not a regulatory or moral hazard problem.  It is entirely the making of the US Federal Reserve, abetted by the US Treasury.  Once again we see exceptionally poor analysis at the Fed and Treasury.  

It is high time for the Fed to run appropriate stress tests to determine how much the banks can bear.  Short-term interest rates must be set to a level compatible with the survival of the US banking sector.  That may mean higher inflation for longer, which is exactly the implication of exploding the money supply by 40% three years ago.  The Fed and Treasury must assume responsibility for their mistakes, rather than trying to foist their errors onto the banking community.

Rigs, Spreads, and March DPR: Huge Shale Oil Supply Revisions

Readers will recall that, for the last several months, I have noted that US oil production per the EIA's weekly Petroleum Status Report was inconsistent with the data from the EIA's monthly Drilling Productivity Report (DPR) 

The graph below shows that state of play as of last week.  The two red arrows at right show the contradictory trends, with total oil production essentially flat while shale oil production is shown rising at a healthy clip.  I have noted that this contradiction would have to be resolved by either increasing the weekly numbers or reducing shale oil output.  

We now have the answer.  

The graph below shows the state of play as of March 14th, when the EIA issued the March DPR.  It shows simply massive downward reductions in US shale oil output.  In the March report, shale oil output from the key plays is reduced by 443,000 bpd for January and 250,000 bpd for February.  If we go back one more month to the January DPR, shale oil production has been reduced by 542,000 bpd for December 2022.  This is a huge revision, more than 4% of total US crude and condensate production over a two month period.

With this revision, as the current graph (below) shows, US shale oil production is largely flat over the last four months, and trends in shale oil supply are consistent with the overall US crude oil supply (including conventional onshore wells, Gulf of Mexico offshore, and Alaska).  I need hardly point out that this is not good news, as the visible peak of horizontal oil rigs is now beginning to pair up with plateauing oil production, just as we would expect.  

The most plausible interpretation is that US crude and condensate production will stagnate for the balance of the year.  As I wrote in The Oil Supply Outlook (Feb. 2), the plateau has been expected since at least 2017 (see Fig. 6), so it should come as no surprise.  I think the surprise, however, will be in production trends going forward.  The EIA sees a long plateau in US oil production.  I think it more likely that we'll see the beginning of an erosion in supply from 2024.

In light of this, President Biden's approval of drilling in Alaska is not hard to understand, but don't expect it to have a material impact on supply anytime soon.

*****

Rig and Spread Counts (for March 10)

  • Rigs counts fell again

    • Total oil rig counts fell, -2 to 590

    • Horizontal oil rig counts were flat at 551

    • The Permian shed 3 horizontal oil rigs.  Not good.

  • The pace of horizontal rig additions fell to -3.0 / week on a 4 wma basis.  

    • This number has been negative for 13 of the last 14 weeks

    • As before, our model suggests that rig counts could erode at a pace of -1 / week for the next two months

  • Frac spreads were flat at 276

  • DUCS were up 9 for the month of February, essentially flat as a statistical matter.

    • At current rig and spread counts and productivity levels, we would expect the DUC inventory broadly flat in the coming month


Rigs and Spreads March 10th.pdf

EIA PSR Week of March 3rd: Steady

  • Crude inventories fell marginally this week

  • Nevertheless, excess crude inventories, as measured by seasonally-adjusted days of turnover, rose 6.7 mb on flat refinery runs at a time when they should be rising seasonally.

  • Product inventories are normal

  • Excess inventories in in aggregate were up 10.6 mb, a pretty hefty, but not unprecedented, gain

  • Total, gasoline, and distillate consumption (supplied) were all down this week but still look good on a 4 wma basis

    • Gasoline supplied in particular is looking healthy, generally a positive signal for the economy

  • US crude and condensate production declined by 0.1 mbpd to 12.2 mbpd, materially unchanged since last August

  • Oil prices remain range-bound.  

    • The futures curve remains in soft contango, with the market expecting normal supply/demand conditions to return in the second half of the year

Russia oil production grows, returns to near pre-war levels

The EIA, the analytics arm of the US Department of Energy, published the February oil markets data in its latest STEO (Short-term Energy Outlook) yesterday.  The EIA reports that Russian oil production rose to 11.13 mbpd in February, the highest since April 2022 and a whopping 1.1 mbpd higher than the EIA's forecast from two months ago.

In fact, as visible on the graph above, the EIA has been 'forecast surfing' since last July.  That is, the EIA anticipated that embargoes and price caps would precipitate production declines, particularly related to the more difficult market in refined products.  Month after month, the EIA forecast that, although production declines had not yet kicked in, they would soon begin.  Thus, the EIA has published a series of forecasts showing a cascade of anticipated production declines, with the Russians thwarting expectations month after month.  The visual impression, as one can see on the graph above, is of a kind of 'forecast surfing', as though the actual data were surfing on an ocean wave.

Why has the EIA proven so wrong to date?  And why has our forecast from last July -- the Black Market line on the graph -- proven so much more accurate?

In general, the EIA's track record for forecasting is about as good as one will find, whether from the investment banks like Goldman Sachs or from specialised consultancies like S&P Global.  The EIA is staffed with competent, dedicated professionals with long-tenure as a rule.  So why the miss month after month for Russian oil production?

The EIA's models are built on market forecasts, emphasizing elements like customer requirements and tanker availability.  There is nothing wrong with this, as oil is normally traded under market conditions (with some exceptions regarding OPEC).  By contrast, our forecast from last July is a black market forecast, that is, it operates under a different set of assumptions.  Chief among these is that prohibitions -- whether on quantities like the EU embargo or on prices like the oil price cap -- tend to lead to evasion accompanied by vast corruption and unbounded hypocrisy.  Thus, we assumed that the Russians would find a way around the sanctions, and the numbers to date suggest this in fact has happened.

The shape of our forecast comes from historical data on black markets, most notably from the US Prohibition era, when alcohol consumption was illegal in the United States.  As the graph below shows, Prohibition was initially successful, but within two years consumption had returned to levels only modestly below that of the pre-Prohibition era.  

The Russian production data show a similar pattern, with the exception that the recovery took two months, not two years​. This is no surprise​, given that the various oil sanctions do not apply to much of the globe, including India, China and the Middle East.   Overall, however, we see the same pattern: initial success ​of the sanctions ​followed by a supply recovery to a level modestly lower than the pre-prohibition state.   We made our Russian oil forecast using this approach, and to date it has held up better than the EIA's numbers.  This, again, is not due to superior forecasting technique, but rather the use of an entirely different forecasting paradigm.  

Forecasting is, of course, a precarious ​endeavor.  The Russians have announced oil production cuts equalling 650,000 bpd, and these should begin to manifest in the March data.  If the EIA is not entirely right, it may not be entirely wrong either.  Still, the Russians are likely to find ways around embargoes and price caps.  The more time passes, the more successful they will be.  That is what a black market model suggests.

All of this is of moderate interest.  Of greater interest are the other manifestations of black markets.  For example, the model suggests that the sanctions and price caps are drawing China into the war on the Russian side -- a topic which we will address in another post.

Rigs and Spreads March 3: The unwind continues

  • Rigs counts fell this again week

  • Total oil rig counts fell, -8 to 592

  • Horizontal oil rig counts also declined, -5 to 561

  • The Permian shed 4 horizontal oil rigs.  No good.

  • The pace of horizontal rig additions fell to -1.25 / week on a 4 wma basis.  

    • This number has been negative for twelve of the last thirteen weeks

  • As before, our model suggests that rig counts could erode at a pace of -1 / week for the next two months

  • Frac spreads were up, +4 at 276

  • At our estimates of rig and spread productivity rates, DUCs would again appear to be falling, and from low levels at that.  Next week’s DPR should confirm or refute DUC trends, but an industry unable to hold even modest inventory levels can be presumed to be in bad shape.

EIA PSR Week of Feb. 27: Plus ça change

Not much change this week.  Excess crude inventories fell marginally; production was unchanged.  The only newsworthy item was gasoline supplied (consumption) which looked the best since the start of the war.

  • Crude inventories were flat this week

  • Excess crude inventories, as measured by seasonally-adjusted days of turnover, fell 2.7 mb.  Seasonality accounts for the modest decline.

  • Crude inventories remain well below long-term levels, but are creeping up

  • Product inventories are normal, with distillate a bit tight

  • Excess inventories in aggregate are a bit high but moving sideways

  • Demand (product supplied) in general is perhaps a bit improved.  

    • Total product supplied is up, but still 3% below normal

    • Distillate supplied remains 7.5% below normal, but recovering

    • Gasoline was the bright spot this week.  Gasoline supplied remains 2.2% below normal (4 wma basis) but is the highest since the start of the war.  The last two weeks have been marginally above normal, suggesting strength in the economy.

  • US Lower 48 crude and condensate production remains unchanged at 11.9 mbpd, as does total oil production at 12.3 mbpd 

  • Oil prices have firmed but remain range-bound.  

    • Strength in gasoline consumption suggests higher prices, but the futures curve remains in soft contango

    • The Russians have announced production cuts which come out to 650,000 bpd as a result of being unable to fully place their refined products in global markets following the Feb. 5 EU products embargo.  (Kudos to the EIA on this call, at least to date.)  Let’s see if it moves prices . 

  • Bottom line: Not much change since last week