Urals softer; ruble stabilizes; looking dicey for Kyiv

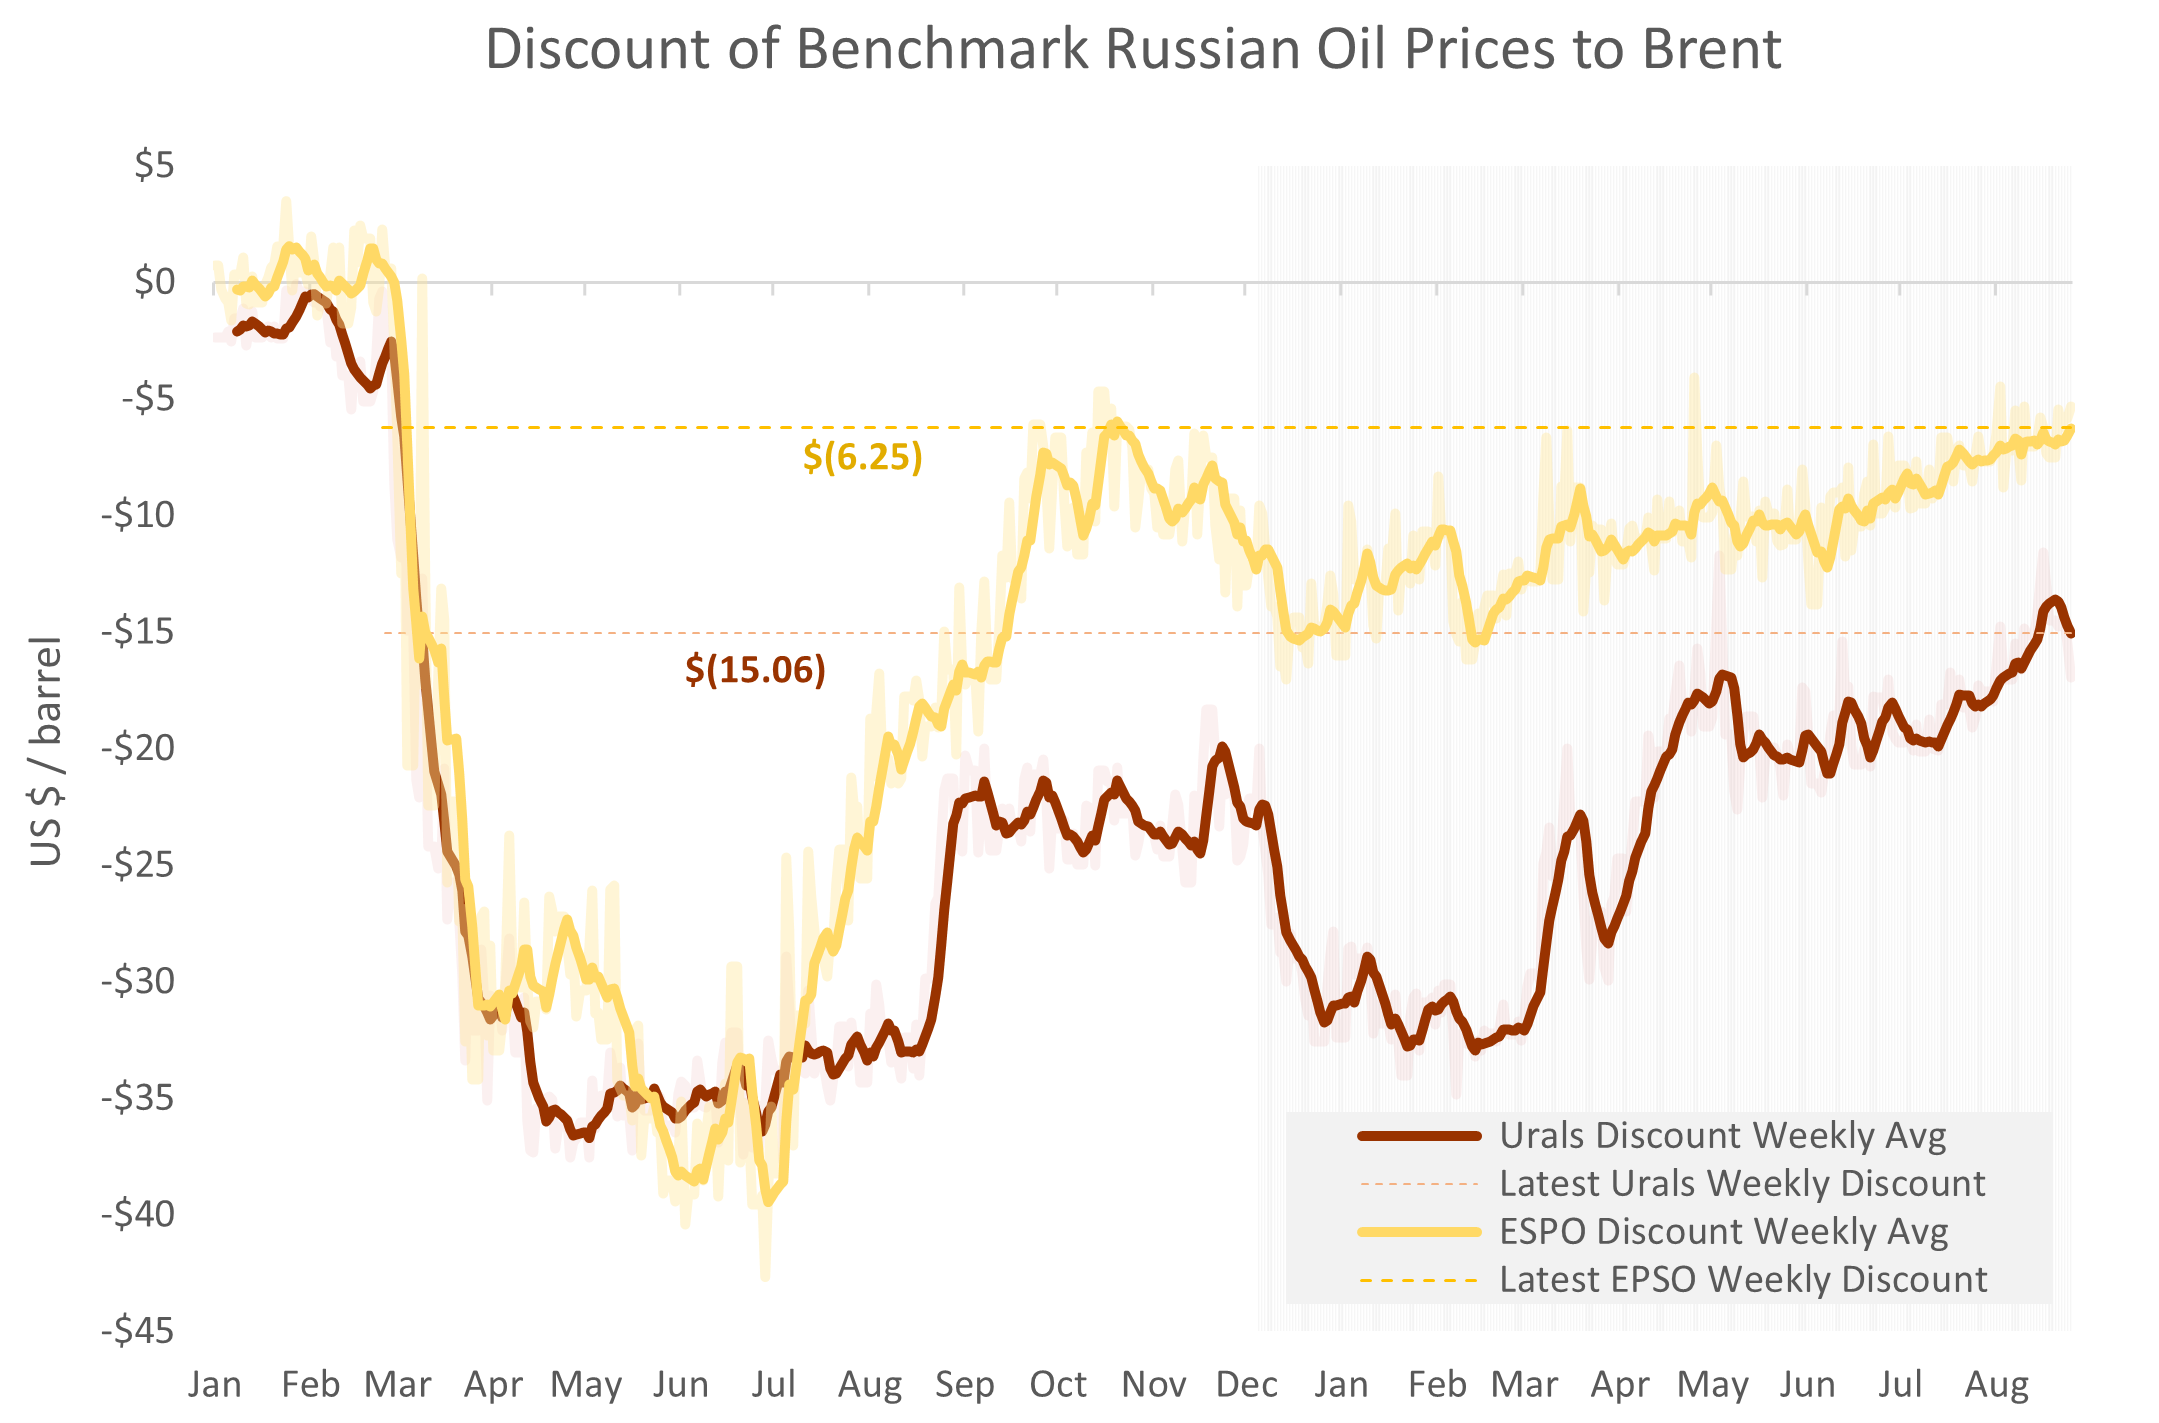
Urals, Russia's crude oil export price to the west, closed last week at $67.54, easing back on softer Brent pricing.  Urals remain more than $7 / barrel above the Price Cap limit.

The Urals discount, the difference between the Urals and Brent oil prices, widened a bit to $15 / barrel for the week, but remains almost the smallest since the start of the war.  The ESPO discount -- the difference between Russia’s Eastern Siberia - Pacific Ocean pipeline price and Brent -- continues to close and is on pace to disappear entirely by year end.  

The takeaway remains as it was.  The Price Cap is materially irrelevant.  Urals is tracking Brent and the discount widens or narrows as Brent varies.  When Brent is stronger, the discount shrinks.  When Brent is softer, as it was this week, the discount widens.

As last week, the Urals price is close to its high since 2015 and is running at nearly $12 / barrel higher than its average for the 2015-2021 period.  The Russians have reason to be pleased.  

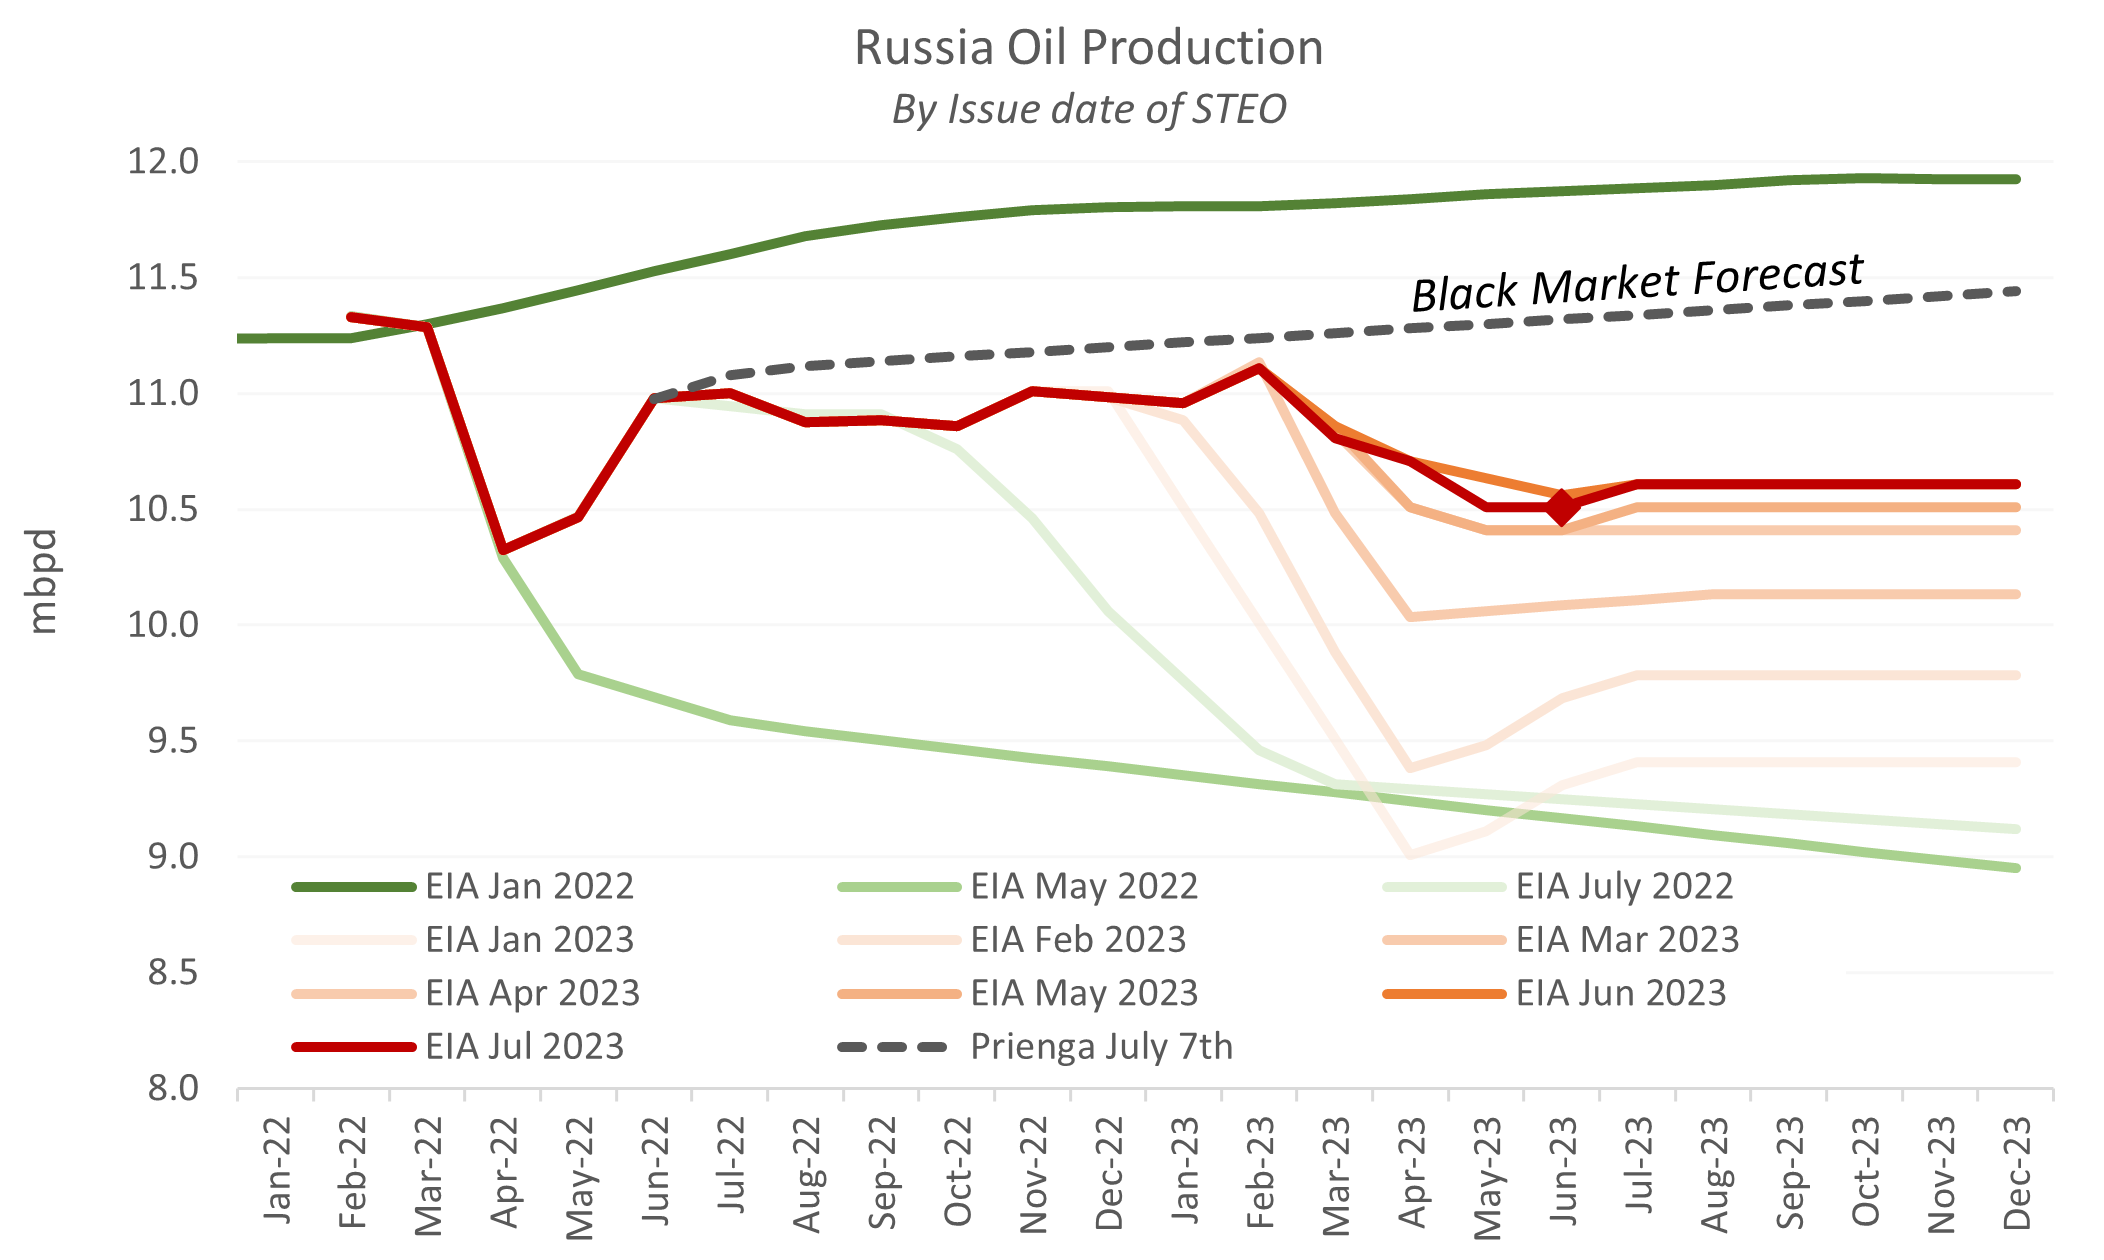
Indeed, Russia appears to be extending its production cuts and looks to cut exports by 300,000 bpd in September.  The EIA estimated Russian oil production largely unchanged at 10.5 mbpd in July, which looks a pretty fair estimate given that the Russians have stopped reporting production levels in recent times.

Hysteria two weeks ago about a collapsing ruble has dissipated, and the ruble has stabilized under 95 / USD.  This is not a surprise.  Reported increases in the Russian money supply did not warrant an exchange rate beyond Rbl 100 / USD.  Moreover, high oil prices and a collapsing Price Cap dictate improving Russian terms of trade, and that should underpin ruble strength.  If one were to guess, go long the ruble here.   

Overall, oil markets developments are favoring Russia at present.  The Price Cap has visibly failed, OPEC+ production cuts are supporting oil prices, and the resulting terms of trade favor the ruble.  As we are now in the last week of summer, on one cares in Washington DC, or to appearances, in Kyiv.  Let's see if the mood changes after Labor Day.  For Kyiv, the situation looks increasingly dicey.  The Biden administration is more likely to paper over the failings of the current regime or admit defeat than to make necessary and constructive modifications to the Price Cap.

The Price Cap requires prompt attention

Last week, I wrote that the Price Cap is dead.  This week, we begin to contemplate its reincarnation.

As expected, Urals broke through the $70 barrier this week, briefly touching $72 intraday before closing at $71.64 on Friday.  This is a hefty $11.64 / barrel above the $60 cap.

The Urals discount -- the difference between Urals and Brent -- has continued to narrow, closing the week at $15.59 ($16.11 on a weekly basis), the lowest since the start of the war, that is, even before the implementation of the Embargo and Price Cap.  We might expect the Urals discount to continue to shrink to the $8-12 / barrel range, but probably not much less, as that would make Russian oil uncompetitive in India, an indispensable customer for Russian crude.  This provides little comfort, alas, because Urals will simply follow Brent up, as it has since May.

The situation is even more unfavorable to the east.  Russia's ESPO (Eastern Siberia - Pacific Ocean pipeline) oil price closed the week above $81, just $2 / barrel below the US benchmark WTI oil price.  We can expect Russia's eastern oil prices to all but close the gap on Brent in the coming weeks to months.

If we look at the Urals oil price in the longer context, the situation is even more disturbing.  The Urals oil price today is actually higher than it was one year ago -- by $6 / barrel -- and, again, that was before the Price Cap was implemented.  In fact, the Urals price today is about the highest it has been for the week since 2015.  

I had said that the Price Cap would prove a liability for the Biden administration come Labor Day, but we may not have to wait that long.  Here's Friday's headline from the Kyiv Independent:

Bloomberg: Russian oil breaks price cap, revenue soars in July

The article notes that Russia's July oil revenues were up 20% from the prior month.  August will be even more dramatic.

How will the Biden administration respond?  With Brent heading towards $90, western leaders may prove reluctant to crack down on shippers violating the Price Cap.  The alternative is an insistence from the administration that, despite its flaws, the Price Cap still holds the Urals price below Brent by $10-15 / barrel.  This will likely remain true, but my Ukrainian readers may nevertheless despair, and with good cause.  Every incremental $10 / barrel equates to $25 bn in annual revenue to the Russian government.  If Urals marches up to $80, Putin may have little difficulty doubling Russia's defense spending.

Such an outcome is, of course, entirely avoidable.  The Price Cap and Embargo were poorly designed.  They can be modified to fit Ukraine's needs.  But don't expect the Biden administration, the US Treasury or the Federal Reserve to make the necessary adjustments.  When faced with a violation of prohibitions, governments' responses historically have been misguided and counterproductive.

Rigs and Spreads Aug. 11: Rig additions in September?

  • Rig counts

    • Total oil rig counts were flat at 525

    • Horizontal oil rig counts fell, -1 to 470

    • The Permian horizontal oil rig count was flat.

    • The Canadian horizontal oil rig count is looking a bit fragile, 19 below last year for the week

  • The US horizontal oil rig count fell at a pace of -4.25 / week on a 4 wma basis.

    • This number has been negative for 35 of the last 36 weeks

  • Frac spreads rose, +5 to 262.  Spread numbers are still too high.

  • DUC inventory came in at 15.1 weeks, in this range since last November

    • In order to hold DUC counts constant, horizontal rigs would have to rise by 57 or frac spreads would have to fall 28.  As such, DUCs appear to be rolling off at an accelerating pace.

  • The breakeven to add rigs has remained in the $75 WTI range for the last several weeks.  Given the recent strength in Brent -- $83 at writing – our model is, for the first time this year, forecasting material rig additions, from mid-September.

  • Weekly US crude and condensate production came in at 12.6 mbpd this week, up 0.4 mbpd over last week

    • Readers will recall that I wrote the following last time:

      • There is a continued disconnect among the crude supply numbers respectively from the weekly PSR, the monthly STEO and the monthly DPR (all EIA reports)…either supply trends are worse than they appear, or the weekly reporting framework needs a bit of revision.  

    • Of course, my friends at the EIA read this report. (What numbers junkie doesn’t?)  And like most analysts, they try their best with the data available, which can be challenging with high frequency numbers

      • The revision is likely to be a ‘true up’, a plug, to bring the weekly numbers into line with the monthly numbers (more on that in the next PSR report).  That is, it does not represent production growth, but rather acknowledges production growth that was not captured earlier in the high frequency (weekly) data

        • This is the role of management, sometimes to sacrifice precision for accuracy.  The right call, in my view.

Understanding Ruble Devaluation and its Implications for the War

Much has been written in the press recently about the collapse of the ruble and inflation soaring to 60% in Russia.  Such claims appear exaggerated and, more importantly, neglect associated implications.  For policy purposes, we are interested in devaluation and inflation as they affect the Kremlin's ability to finance its war and contain public discontent at home.  

Analysts tend to focus on year-ago data, but Russia's pre-war position is the appropriate baseline.  Before the war, the ruble was trading at 74 / USD.  With the start of hostilities, oil prices soared and Russian consumer goods imports collapsed, leading to a 40% revaluation of the ruble.  Over time, oil prices declined and Russia re-oriented its imports, leading the ruble to fall back to its pre-war level.  That trend has continued, with the ruble today at 98 / USD, representing a devaluation of 25% since the start of the war.  This is certainly significant, but not catastrophic under the circumstances.

Currencies can devalue for a number of reasons, for example, underlying terms of trade, comparative interest rates, or sanctions.  Large devaluations, however, are often linked to loose monetary policy, that is, the government printing money to cover expenses.  We can analyze this using the Quantity Theory of Money (QTM).  Basically, QTM holds that, if a country doubles the currency in circulation, the price of goods will accordingly double (twice the money chasing an unchanged amount of goods), and the currency will devalue by half to hold the real exchange rate constant.  (More here.)  QTM has not been fashionable with economists recently but, nevertheless, remains a useful tool.  For example, a QTM analysis of the Federal Reserve's pandemic monetary policy largely predicts the US inflation of the last three years.

The Russian Central Bank reports that Russian money in circulation rose from 15.2 trillion rubles in September 2022 to 17.9 trn rubles in June 2023, representing a money supply increase of 21% on an annualized basis.  This is consistent with the 21% pace of devaluation in the same period.  These in turn suggest Russian domestic inflation around 20%, rather than the Bank of Russia’s forecast of 5.0–6.5% for 2023.  The Bank's surprise interest rate hike to 8.5% also suggests inflation at least in the high single digits.   Thus, QTM analysis suggests fairly stiff, but not catastrophic, inflation in Russia for 2023.

We can also assess an increase in the money supply from the fiscal perspective.  Based on the Sept.-June period, money in circulation in Russia has been rising at the pace of 3.6 trn rubles (cc $45 bn) per year.  This is the equivalent of 2.4% of Russia's GDP.  Put another way, the Russian government appears to be covering a budget deficit of 2.4% not through borrowing or fiscal adjustments, but rather by printing money.  This implies Russia's net budget deficit is larger than reported.  Again, the magnitude is not disastrous, but it does underscore the Russian government's cash hunger, about which I have written on several occasions.

Russian defense spending is running at twice budget levels, implying an additional 6 trn rubles in military spending anticipated for the second half of 2023.  If this is covered by printing money, it would imply inflation moving towards 30% and an exchange rate of 110 rubles / USD by year-end, with devaluation continuing in 2024.

For Putin, money is tight, but the situation is not yet critical.  Still, our analysis suggests that the Kremlin has precious little wiggle room, something which can be exploited by Ukraine and its allies.

The Price Cap is Dead

The Urals oil price -- the price Russia receives for its western crude exports -- continues to rise, reaching $69.22 / barrel on Friday.  This is the highest since November and well above the $60 Price Cap.  

The Urals discount -- the difference between the Urals and Brent oil prices -- continues to erode.  At week end, the discount stood at $16.67 / barrel, narrowing by $3 / barrel compared to a month ago.  On a weekly basis, the current discount is the smallest since the start of the war.  

Both the Urals price and the Urals discount signal that the Price Cap is dead.  This is all the more so as Saudi oil production cuts will likely hold Brent at elevated levels, implying that Urals will also remain above the Cap limit.  Indeed, strength in Brent suggests that Urals will break through the $70 threshold this coming week.  The political optics will be poor.

Governments inevitably attempt to counter the evasion of prohibitions, including on the sale of Russian oil above the Cap, with one of two counterproductive policies.  The first of these is denial or complacency, which was this week's primary menu offering.  Reuters reports that Acting Assistant Secretary for Economic Policy Eric Van Nostrand, at a London conference, hailed the Price Cap as a successful part of the multilateral sanctions regime imposed on Russia over its invasion of Ukraine.  Clearly, Urals at nearly $70 / barrel cannot be considered even remotely a policy success.

Governments also turn to enhanced enforcement, and Van Nostrand duly noted that Washington and its partners were working to thwart any evasion. This is proving progressively more challenging as Russia's shadow fleet of crude oil tankers expands.  

The standard responses to prohibitions evasion almost inevitably prove failures. They will this time as well.

No one will care much about the issue in the dog days of summer, but come Labor Day, a mortally wounded Price Cap will become a political liability for the Biden administration.  The topic will be back on the political agenda, as I noted last week. We may see a 12th sanctions package on Russia to remedy the shortcomings of the first eleven.   

EIA PSR Week of July 28th: More of the same; the Price Cap has collapsed.

  • More of the same this week.

  • Excess crude inventories, as measured by seasonally-adjusted days of turnover, fell 8 mb to 25 mb, a notable fall but to a level in the range seen in the last few weeks

  • Excess crude and key product inventories (collectively CDG, that is, crude, gasoline and distillate) were largely unchanged at 22 mb, mostly due to soft demand for products this week.  

    • There’s nothing special about these numbers which should move oil prices one way or the other.

  • Incentive-to-store analysis suggests the market continues to anticipate normal supply/demand conditions for the next year, just as it has since at least December.

  • US oil production remains flat at 12.2 mbpd.  Production is up only 0.1 mbpd compared to a year ago

  • Oil prices firmed Thursday after a slightly softer patch on Wednesday, with WTI $80.33 at writing.

  • The Russian Oil Price Cap is facing total collapse, with the Russian Urals price standing at $68.38 on Thursday, well clear of the $60 / barrel cap.

EIA PSR Week of July 28.pdf

Urals has broken containment; to the political agenda soon

The Urals oil price -- the price Russia receives for its western crude oil exports -- ended the week at $67.42, well clear of the $60 / barrel price cap.  Urals has exceeded the cap limit for the last seventeen days.  

The Urals discount -- the difference between the Urals and European benchmark Brent oil price -- is holding steady at just under $18 / barrel, as it has for the last week or so.  The discount has narrowed by $2 / barrel compared to the May-June average.

As I have written on several occasions, the Price Cap lost its effectiveness in April. Since that time, Urals has tracked Brent with a discount of about $20 / barrel.   When Brent exceeds $80, Urals by extension exceeds $60.  

Given that oil market fundamentals appear set to prop Brent above $80 going forward, the Price Cap can now formally be considered a failure.  Policy-makers will face some difficult choices in their attempts to respond.  Be that as it may, I think we can assume the Price Cap will return to the political agenda in the coming weeks, certainly after Labor Day.

How long will the war last?

Many in the media and politics anticipated dramatic and rapid Ukrainian victories during the summer of 2023. Nevertheless, progress on the ground has been slow, raising the prospects of a protracted war.

This begs the question: Just how much longer could the war last?

The precedent of prior wars is one way of looking at the issue.  On the graph below, we consider the three wars perhaps most similar to the current war, each involving Russia.

The Russo-Japanese war of 1904-1905 lasted one year and three months. The current war has already run longer, and therefore we can safely dismiss this example as relevant.

The next longest war of interest is the Crimean War of 1853-1856, which lasted two and one-half years.  If this were the template, the current war might be expected to end in August 2024.  

The longest arguably comparable war was World War I, which ran three years and seven months, implying an end date of September 2025.

If one were to guess, the Crimean War would seem the likely precedent.  By August 2024, the Ukrainians will have eliminated 430,000 Russian soldiers (if we accept the Ukrainian body count and 500 incremental eliminations per day).  Russia lost 450,000 soldiers in the Crimean War, so the scale would appear similar, granting that imperial Russia’s population was approximately half the current level of the Russian Federation.

Russia has had longer conflicts, including the Second Chechen War, which lasted ten years, or for that matter, the first phase of the Ukrainian War, which ran from 2014-2022. Nevertheless, both these wars were low level affairs from the Russia perspective.  For example, total Russian losses in the Second Chechen War are estimated at no more than 14,000, fewer than the Russians are losing every month in Ukraine.  Large countries like the US and Russia can maintain low level conflicts almost indefinitely.

Major wars, however, are another matter, and the current conflict in Ukraine constitutes a major war from both the Russian and Ukrainian perspective. The dynamics are therefore likely to follow those of other major wars. This suggests slightly better than even odds that the war ends within a year and near certainty that it ends by September 2025.

I would note that in the three comparable wars — the Russo-Japanese, the Crimean and the first World War  — the Russians lost.

Urals at $62.60. Time to panic?

The Urals oil price -- the benchmark price for Russian crude oil exports to the west -- held resolutely above the cap limit of $60 / barrel all last week, closing at $62.60 on Friday.  Russia's eastern ESPO oil price also rallied, ending the week at $72, only $5 / barrel below the US West Texas Intermediate (WTI) benchmark.

​More interestingly, the Urals discount, the difference between the Urals and Brent oil prices, narrowed, closing the week around $18 / barrel.  The discount appears to narrow when Brent exceeds $80 / barrel.  This makes intuitive sense, as higher oil prices reflect greater bargaining power by sellers, including the Russians, which may cause the discount to narrow.  Put another way, when Brent is above $80, Urals may rise faster than Brent.

​Do last week's developments signal the collapse of the Price Cap?  Maybe not.  Urals stood above $60 for most of April, and then retreated back below the cap limit.  Therefore, to announce the death of the Price Cap would seem premature.  Still, the ESPO discount has been narrowing gradually since March, so the Price Cap on Urals may also become less binding over time.  

It is not yet time for panic, but concern is certainly warranted.

Rigs and Spreads July 21: Ugly

  • Rig counts

    • Total oil rig counts declined, -3 to 534

    • Horizontal oil rig counts fell, -4 to 483

    • The Permian horizontal oil rig count was down, -3.  The Permian has been losing rigs and a fair pace for the last two months.

  • The horizontal oil rig count fell at a pace of -3.25 / week on a 4 wma basis.

    • This number has been negative for 32 of the last 33 weeks

  • Frac spreads rose, +11 to 274.  This is not sustainable.

    • DUC inventory has fallen below 15 weeks for the first time, 14.7 weeks today

    • In order to hold DUC counts constant, horizontal rigs would have to rise by 68 or frac spreads would have to fall 34.

  • The EIA issued the July DPR this week.  Highlights:

    • Crude and condensate production from key shale plays rose in June to 9.23 mbpd, up 36 kbpd from May

    • Permian production was up 11 kbpd in June.  Permian production growth has averaged 12 kbpd / month over the last three months

    • The Permian is really slowing down; growth is being sustained by the Bakken, with support from the other secondary plays

    • Compared to last year, total shale oil production is up 0.7 mbpd; the Permian is up 0.5 mbpd

  • Production is being sustained in part by the cannibalization of the DUC inventory

Urals breaks through the $60 cap

Russian Oil Production

The EIA issued its estimates for Russian oil production this past week. The EIA is the statistics arm of the US Department of Energy.  It issues a large number of reports, including its monthly Short Term Energy Outlook, which is one of the wonders of the analytical world and the source of data on the graph below.  

The EIA reports that Russian oil production fell to 10.5 mbpd in June, a bit below earlier estimates and 7% below its pre-war level.  This is also 11% below EIA's pre-war forecast for Russian oil output, which in fact is similar to observed reductions in other prohibitions.  For example, in the Prohibition of the 1920s, per capita US alcohol consumption fell by 15%.  Prohibitions, including price caps and embargoes, are almost universally unsuccessful, a theme to which I regularly return in these analyses.  For now, the EIA sees Russia's June oil production as the low point going forward.  I think it fair to say that the EIA has low confidence in its forecast, but in any event, it anticipates no further reductions in Russian oil output.

Russian Crude Oil Prices

Russian crude oil prices are generally linked to its Urals oil price to the west and the ESPO (Eastern Siberia–Pacific Ocean oil pipeline​) price to the east.  Historically, both the Urals and ESPO prices were essentially indistinguishable from the European benchmark Brent oil price, at most with a discount of $1-2 / barrel.  Since the start of the war, ​however, ​the Urals and ESPO prices have diverged from Brent​ by as much as $35 / barrel​.  

A price cap of $60 / barrel was implemented by Ukraine's western allies on December 5th.  Since that time, the Urals price has generally remained below the cap threshold.  By contrast, the ESPO price has never fallen to or below the cap level.

The last reported price for Urals was $60.06 / barrel, that is, above the cap level.  This is not the first time this has occurred, as the posted Urals price was above the cap for most of April.

​Russian Oil Price Discounts

Russian oil prices can also be viewed in relation to Brent.  The Urals discount -- the difference between the Urals and Brent oil prices -- now stands at just under $20 / barrel, where it has been since mid-April.  Note that the Urals discount is effectively the smallest since the start of the war and smaller than before the imposition of either the embargo or price cap.   This is similarly true for the ESPO discount (the difference between the ESPO and Brent oil prices).

This suggests that the discount, rather than the price cap, is gating the Urals oil price.  That is, if Brent rises, the Urals price will follow at a distance of $20 / barrel.  Brent is just above $80, and the Urals is just above $60.  If Brent moves to $90, then Urals may be plausibly expected to rise to $70.  ​

​Of course, the western allies can move to sanction Greek shippers and Indian oil refineries for price cap breaches, but this comes at a political cost.  Further, the higher the Brent oil price, the less political leverage the western powers will enjoy.  

Forecasting oil prices is a hazardous occupation, but oil demand is expected to outstrip supply for the balance of the year and into 2024.  Higher Brent prices are certainly possible.

Urals today stands at $60 and ESPO above $71, implying an aggregate selling price around $63 / barrel for Russian crude oil exports.  ​​The Urals and ESPO oil prices averaged $56 / barrel from 2015 to 2021.  Current Russian selling prices are therefore already above the prior seven years' average.  If Brent moved up to, say, $100 / barrel, Russia's finances could improve quickly and materially.

​The price cap and embargo as currently implemented are misspecified and counter-productive.  ​Chinese and Indian interests are capturing the value of the Urals oil price discount, which in turn serves as 'store credits' for Russia to purchase influence and physical goods.  Put another way, the price cap is channeling funds into the Chinese military industrial complex when, were the cap properly structured, those funds would go in significant part to the US defense industry.  We are speaking of billions of dollars.

EIA PSR Week of June 7: Peak Oil in April?

  • This week’s data is distorted by the July 4th holiday and so not too much should be read into it

  • Nevertheless, excess crude inventories, as measured by seasonally-adjusted days of turnover, have been rising for the last five weeks, up 23 mb during that stretch

  • Product inventories were up, no doubt because tank trucks were not moving on the 3rd and 4th to deliver fuel to retailers

  • Product supplied (consumption) was off this week, again no doubt due to the holiday (ie, product supplied measures wholesale deliveries to retail gas stations, not fuel sales to consumers)

  • Oil prices have firmed

    • WTI stands around $75 with Brent at $80

    • Our Incentive to Store analysis sees slightly tighter balances going forward, but nothing unusual

  • The EIA has both reduced expectations for prospective world oil supply and raised demand expectations by about -0.5 and +0.1 mbpd respectively.  With this, excess crude balances look to head downward from around 600 mb currently to nearer 400 mb a year from now.  

    • This development should be considered constructive for oil prices, but still represents high levels of excess crude, perhaps consistent with $90 Brent, but on paper, not $110 Brent

Of greater interest is the EIA’s forecast for US crude and condensate production, with the graph below showing C+C production from the Lower 48 continental states (which excludes the Gulf of Mexico offshore and Alaska).  Most L48 production is shale oil.

  • L48 supply growth in H1 2023 comfortably exceeded earlier EIA expectations, but in fact supply peaked in April and has been declining every month since, down 200 kbpd through June.

  • The EIA sees this trend bottoming and turning back up from July.  

  • This is a bit hard to understand, given that rig counts have been declining for seven months and frac spreads are unchanged in more than a year.

  • In any case, the EIA now sees April 2023 as the expected peak for US C+C production through year-end 2024

Rigs and Spreads July 7: Rolling off

Last time, I wrote

Declining rig counts and rising spreads are an unsustainable combination at current levels.  This will lead to an accelerating erosion of DUC inventories, which have continued to fall almost without exception for the last three years.
Rebalancing the rig / spread ratio to hold DUC inventories constant would require either 62 additional horizontal rigs or a reduction in the spread count by 31.  Given that rigs have been in secular decline for the last half year and given that the breakeven to add rigs appears to require $80 / barrel WTI, it is hard to see a robust rig count recovery at current WTI oil prices below $70 / barrel.  The other alternative is a decline in spread counts, probably accompanied by a continued roll off in DUC inventories.  

We see just this development this week: another fall in rig counts and an even larger pro rata decline in the number of spreads.

*****

  • Rig counts

    • Total oil rig counts declined, -5 to 540

    • Horizontal oil rig counts fell, -6 to 489

    • The Permian horizontal oil rig count was down, -5

    • The rig count has fallen by 83 (15%) since its November peak, and stands at the level of April 2022

  • The horizontal oil rig count fell at a pace of -3.25 / week on a 4 wma basis.

    • This number has been negative for 30 of the last 31 weeks

  • Frac spreads fell, -12 to 260.  This is not the recent low, but pretty close

  • Where does all this turn around?

    • We are seeing a cyclical type of downturn in the rig count, the sort normally associated with recessions or over-production and resulting soft oil prices

    • But that’s not the story today.  US crude oil inventories are normal, the economy continues to expand at a reasonable pace, and oil prices are not particularly soft at nearly $74 / barrel WTI

    • How much do prices have to rise to stimulate a revival in drilling?  Or does that occur at any price?  

    • Is the reality that operators have simply drilled through their best inventory, that shales are a kind of one-trick pony, a comparative flash in the pan?  

    • This seems to be the case.  It is hard to avoid the impression that some kind of implosion is coming, a substantially more severe collapse of US shale oil production than is currently anticipated for the back half of this decade.

Rigs and Spread July 7.pdf

EIA PSR Week of June 30: Chugging along, with signs of life in aviation

  • Excess crude inventories, as measured by seasonally-adjusted days of turnover, have been rising, up 4 mb to 22 mb

  • Product inventories on a seasonally adjusted days of turnover basis fell 5 to -11 mb

  • Crude and key product inventories, taken together, are down marginally to +9 mb.  

  • SPR draws continue at 208 kbpd this past week.

  • Except jet fuel, demand remains range-bound

    • Gasoline demand is 3.3% below normal

    • Distillate had a bad week, but primarily due to base year effects

    • Jet fuel has its best week since the start of the pandemic, down only 3.4% below normal after averaging 10% below normal since the start of the year

  • US crude and condensate production has been bouncing around in the low 12s, 12.4 mbpd this past week, supporting the notion that US oil production has peaked

  • Oil prices remain range-bound, as they have since the beginning of May

    • WTI stands around $72 with Brent at $77, in fact their average price over the last twelve weeks

    • Our Incentive to Store analysis suggests that the market anticipates normal balances for the rest of the year, essentially a business-as-normal scenario, notwithstanding mooted Saudi production cuts

  • Finally, it is hard to avoid the impression that the Ukraine war has adversely affected US oil consumption.  

    • Gasoline consumption is about 4% lower than immediately prior to the war

    • Distillate consumption is off more than 10% compared to the pre-war period.

June Oil Price Cap: Largely Unchanged

Brent has languished in the mid-$70s since early May, notwithstanding Saudi production cuts.  China's economy looks increasingly suspect, and the world has plenty of excess crude inventories at present.  The Urals oil price, the price Russia receives for its exports to the west, has similarly languished in the mid-$50s / barrel, latest at $56.35 / barrel and under the $60 cap threshold.

The Urals discount, the difference between the Urals and Brent oil prices, has also remained largely unchanged, latest at just under $20 / barrel.  The discount, as before, remains smaller than before either the EU oil embargo or the price cap took effect.  

Rigs and Spreads June 23: Something bad this way comes

  • Rig counts fell this week, as has become customary

    • Total oil rig counts declined, -6 to 556

    • Horizontal oil rig counts fell, -2 to 496

    • The Permian horizontal oil rig count was down, -2

    • The rig count has fallen by 76 (13%) since its November peak and stands at the level of April 2022

  • The horizontal oil rig count fell at a pace of -5.25 / week on a 4 wma basis.  

    • This number has been negative for 28 of the last 29 weeks

  • Frac spreads rose, +9 to 277, up 21 in just the last three weeks

  • The EIA published the June DPR this past week.  Highlights:

    • In the June DPR report, crude and condensate production from key shale plays rose to 9.14 mbpd, up 48 kbpd from April

    • Permian production was up 9 kbpd in May.  Permian production growth has averaged 24 kbpd / month over the last three months

    • The EIA revised up production from key shale plays going back to November 2021, with revisions averaging a hefty 85 kbpd since the start of the year.

    • Compared to last year, total shale oil production is up 0.7 mbpd, of which the Permian contributed  0.5 mbpd. On paper, this is still decent growth at the annual horizon

  • Not all is happy, however

    • Permian oil production is effectively unchanged in the last four months

    • Shale oil production gains from the last two months have come from the minor plays.  Of these, only the Anadarko is showing secular growth.  The rest – the Niobrara, the Bakken and the Eagle Ford – are just revisiting production levels of late last year.  

    • Declining rig counts and rising spreads are an unsustainable combination at current levels.  This will lead to an accelerating erosion of DUC inventories, which have continued to fall almost without exception for the last three years.

      • Rebalancing the rig / spread ratio to hold DUC inventories constant would require either 62 additional horizontal rigs or a reduction in the spread count by 31.  Given that rigs have been in secular decline for the last half year and given that the breakeven to add rigs appears to require $80 / barrel WTI, it is hard to see a robust rig count recovery at current WTI oil prices below $70 / barrel.  

      • The other alternative is a decline in spread counts, probably accompanied by a continued roll off in DUC inventories.  

    • None of this bodes well for the future of US shale production.

Rigs and Spreads June 23.pdf

May Russia Oil Price Cap: Failing, as Dangers Rise

Last month I wrote that "not everyone believes" the EIA's estimate for Russia's April oil production, and in fact, the EIA has revised up Russia's oil production to 10.71 mbpd, 0.2 mbpd higher than its prior estimate for April.

The EIA reports Russian oil production falling in May by 0.1 mbpd to 10.63 mbpd, but that estimate may also prove too conservative.  Russia no longer publishes oil production statistics, so firm numbers are hard to come by.  Notwithstanding, MarineLink reports that Russia's seaborne oil exports from its western ports hit a 4-year record of 2.4 million barrels per day (mbpd) in May.  In the first quarter, Russia's gasoline exports were up 37% over the same period in 2022.  Russia’s exports suggest high levels of oil production in that country.

Fig. 1

Source: EIA, Princeton Energy Advisors

In terms of oil prices, the situation has not changed much since our last report.  Despite Saudi production cuts, Brent continues to languish, falling back to $75 / barrel at writing.  As a result, Russia's Urals oil price also remains below the $60 / barrel cap, although, as before, Russia's eastern ESPO oil price remains above the cap threshold, standing at nearly $66 / barrel at week end.

Fig. 2

Source: Bloomberg, OilPrice.com, PPA

The Urals discount -- the difference between the Urals and Brent oil prices -- widened a bit this week to $21 / barrel on average.  Notwithstanding, the Urals discount is now smaller than before the price cap was implemented, leaving the impression that the price cap today is wholly ineffective.

Fig. 3

Source: Bloomberg, OilPrice.com, PPA analysis

The rationale for the Saudi production cut of this past week and its almost immediate failure warrants a brief digression. This requires a technical explanation of the concept of excess inventories, for which I apologize up front.

A typical US refinery will normally hold 25 days of crude oil in inventory for day-to-day operations. For example, if a refinery were processing 1 million barrels per day (mbpd) of crude oil, we would expect it to hold 25 million barrels (mb) of crude in inventory. Inventories above this level are excess, in the sense that refiners and traders would normally be incentivized to run these inventories down to normal operating levels. If our hypothetical refinery had 30 mb of crude inventory but needed only 25 mb, we could say that 5 mb were excess.

We can also model this on a global scale, with the EIA providing both historical and forecast inventory levels. If we run the numbers, we can see that excess crude inventories have grown from 330 million barrels (mb) at the beginning of the war to 630 mb today. That's a big number. Running off current excess inventories could take more than a year, and possibly two.

Fig. 4

Source: EIA, PPA analysis

Excess inventories have been accumulating because global oil demand, particularly from China, was unexpectedly weak in the first half of the year.  Further, the EIA and other analysts expected Russian supply to be pulled from the market, and that clearly has not happened.  Indeed, it is reasonable to assume that Russia is pumping oil as fast as it can to sate its hunger for cash.  This is typical of state-owned producers operating in cartels like OPEC.  Private companies like Exxon or Shell produce more oil when prices are high and cut production when prices are low.  OPEC does exactly the opposite.  When prices are low, cartel members need more cash to balance their national budgets and therefore produce more oil, thereby depressing already weak oil prices.  When prices are high, OPEC tends to be slow to add capacity in order to maximize selling prices per barrel.  Russia appears to be acting as OPEC does in similar situations, that is, maximizing production to maximize revenue in a weak oil price environment given its wartime needs.

The EIA has revised its global oil demand forecast upward and global supply downward following the recently announced Saudi production cut.  Nevertheless, these revisions offer no more than the prospect of a balanced market.  That is, without Saudi production cuts, excess inventory would have continued to accumulate, pushing prices down even further.  If we accept the EIA's estimates of global balances and its forecasts for global oil supply and demand as plausible -- and I do -- then oil prices should remain reasonably soft, largely in the recent price range, for the balance of the year.  In other words, oil prices remain soft because the world has massive excess crude oil inventories.

This is largely good news for Ukraine, as oil prices seem on track to remain muted, thereby depriving Russia of much needed cash.  

On the other hand, the structure of both the embargo and price cap remain dreadful.  The Urals and ESPO price discounts are clearly being converted into 'store credits' which Russia can and is using to buy influence and actual goods and services.  Chechen strongman Ramzan Kadyrov showed footage of "new vehicles purchased for Chechen units participating in the SMO".  These are China Tigers, armoured personnel carriers, produced by Shaanxi Baoji Special Vehicles Manufacturing, a north China military contractor.  Moscow is no doubt the indirect purchaser. But with what?  The Urals discount provides leverage and a source of funds for Moscow to purchase Chinese arms.  The price cap and embargo, as currently structured, are a significant factor in drawing China into the conflict.  It's not just an alliance of like-minded autocrats. There's also money in it.

Fig. 5 China Tiger APV

Now imagine that Russian oil sanctions were manifest in a legalize-and-tax system allowing the western powers to capture the value of the Urals discount and give it to Kyiv.  Properly run, such a program would generate $4.5 bn / month for the war effort.  

Consider: On June 6, the Russians blew up the Kakhovka Hydroelectric Power Plant.   Ihor Syrota, head of Ukraine's state-owned energy company Ukrhydroenergo, was quoted in the Kyiv Independent as saying that reconstruction will take at least five years and $1 billion.  If the Urals discount were captured by the western allies and provided to Ukraine, the Kakhovka dam could be rebuilt with one week's cash flow.  And the contract could be offered to China.  This would give Beijing a reason to take a positive view of Kyiv and refrain from leaning excessively towards the Russian side.  

As currently constructed, the price cap and embargo are creating a coalition of countries with a financial interest in perpetuating the conflict and acceding to Russia's requests.  Take that money away, give it to Ukraine, and Russia's international support will quickly fade, as will the appetite of Russia and China to prolong the war.

Rigs and Spreads June 2: Plummeting


  • Rigs counts fell sharply -- again

    • Total oil rig counts declined, -15 to 555

    • Horizontal oil rig counts fell, -14 to 502

    • The Permian horizontal oil rig count was down 4

    • The rig count has fallen by 50 (9%) since March alone, and stands at the level of April 2022

  • The pace of horizontal rig additions fell an eye-opening 8.25 / week on a 4 wma basis.  

    • This number has been negative for 25 of the last 26 weeks

  • Frac spreads were -4 to 256, a level last seen in September 2021

    • Spread counts are down 38 (13%) in just the last six weeks

  • Overall, the picture looks reasonably grim

    • Both rig and spread counts continue to roll off, sharply in the last few weeks

    • The implied breakevens are well above $80 / barrel WTI

  • Until we see technological innovation at scale such as Exxon has floated, the shale sector could be headed for a rough patch indeed


EIA PSR Week of May 26th: Party on

  • Excess crude inventories, as measured by seasonally-adjusted days of turnover, fell 2 mb this week to 5 mb.  There is materially no excess crude inventory and trends are constructive overall.

  • Product inventories on a seasonally adjusted days of turnover basis fell 4 to -7 mb

  • Crude and key product inventories, taken together, are down 5 mb to -6 mb.  Overall, crude and key product inventories together are a bit tight, supportive of prices around the $80 WTI range

  • SPR draws continue at 360 kbpd this past week.

  • Demand continues to hang in there

    • Gasoline demand is 2% below normal, but about the best this year on relative terms

    • Distillate is normal, and again about the best in relative terms this year

    • Jet fuel remains 9% below normal, but showing a gradual normalizing trend

  • US crude and condensate production fell by 0.1 mbpd to 12.2 mbpd, unchanged in the last six months

    • US oil production has peaked

  • Oil prices have tanked once again

    • Once again, this panic is unsupported by incoming US data.  By implication, though, China is struggling, which is also much discussed in the press

  • As have been typical in recent months, both recessionary and expansionary signals are evident in the economy, and it is not clear which will dominate.  As far as the US weekly oil data is concerned, however, the party is still on.

Rigs and Spreads May 19: Unraveling

  • Rigs counts fell sharply

    • Total oil rig counts declined, -11 to 575, no higher than the level of last June

    • Horizontal oil rig counts fell, -10 at 522, here too back to June 2022 levels

    • The Permian horizontal oil rig count was down 4

    • Our model suggests continued falls in general, although next week could see a technical rebound, given this week’s steep decline

  • The pace of horizontal rig additions fell to a whopping -5.75 / week on a 4 wma basis.  

    • This number has been negative for 23 of the last 24 weeks

  • Frac spreads were -10 to 262, a level no higher than November 2021

  • Overall, the picture looks increasingly like secular decline

    • In the Permian, rig counts remain flat, essentially unchanged since last summer

      • As we noted last week, Permian production growth is slowing steadily and the Permian supply could peak as soon as Q3, and most likely within a year

      • Permian production growth has been maintained by the cannibalization of the play’s DUC inventory, down by an eye-opening one-third over the last year.  

      • At present, the Permian has only 7.8 weeks of DUC inventory at hand, a record low for the play and suggestive of a material lack of promising drilling prospects

    • In the other plays (all excluding the Permian), the rig count has been falling, although oil production has remained relatively steady

      • Given falling rig counts in these plays, their oil production may begin to slip off recent levels by, say, Q4 or early next year