With the Strait of Hormuz closed, the press is full of discussions of 'oil shocks', and wild oil price forecasts are being tossed around. What does it all mean? And what’s an oil shock anyway?
Economic shocks arise from oil’s unique characteristics. For practical purposes, oil in the form of gasoline, diesel and jet remains the monopoly fuel for transportation. Moving people or goods, especially over longer distances or in quantity, requires oil. Remove the oil, and neither people nor goods can move as much as before, contracting economic activity. Oil is mobility, and mobility is fundamental to the functioning of the economy.
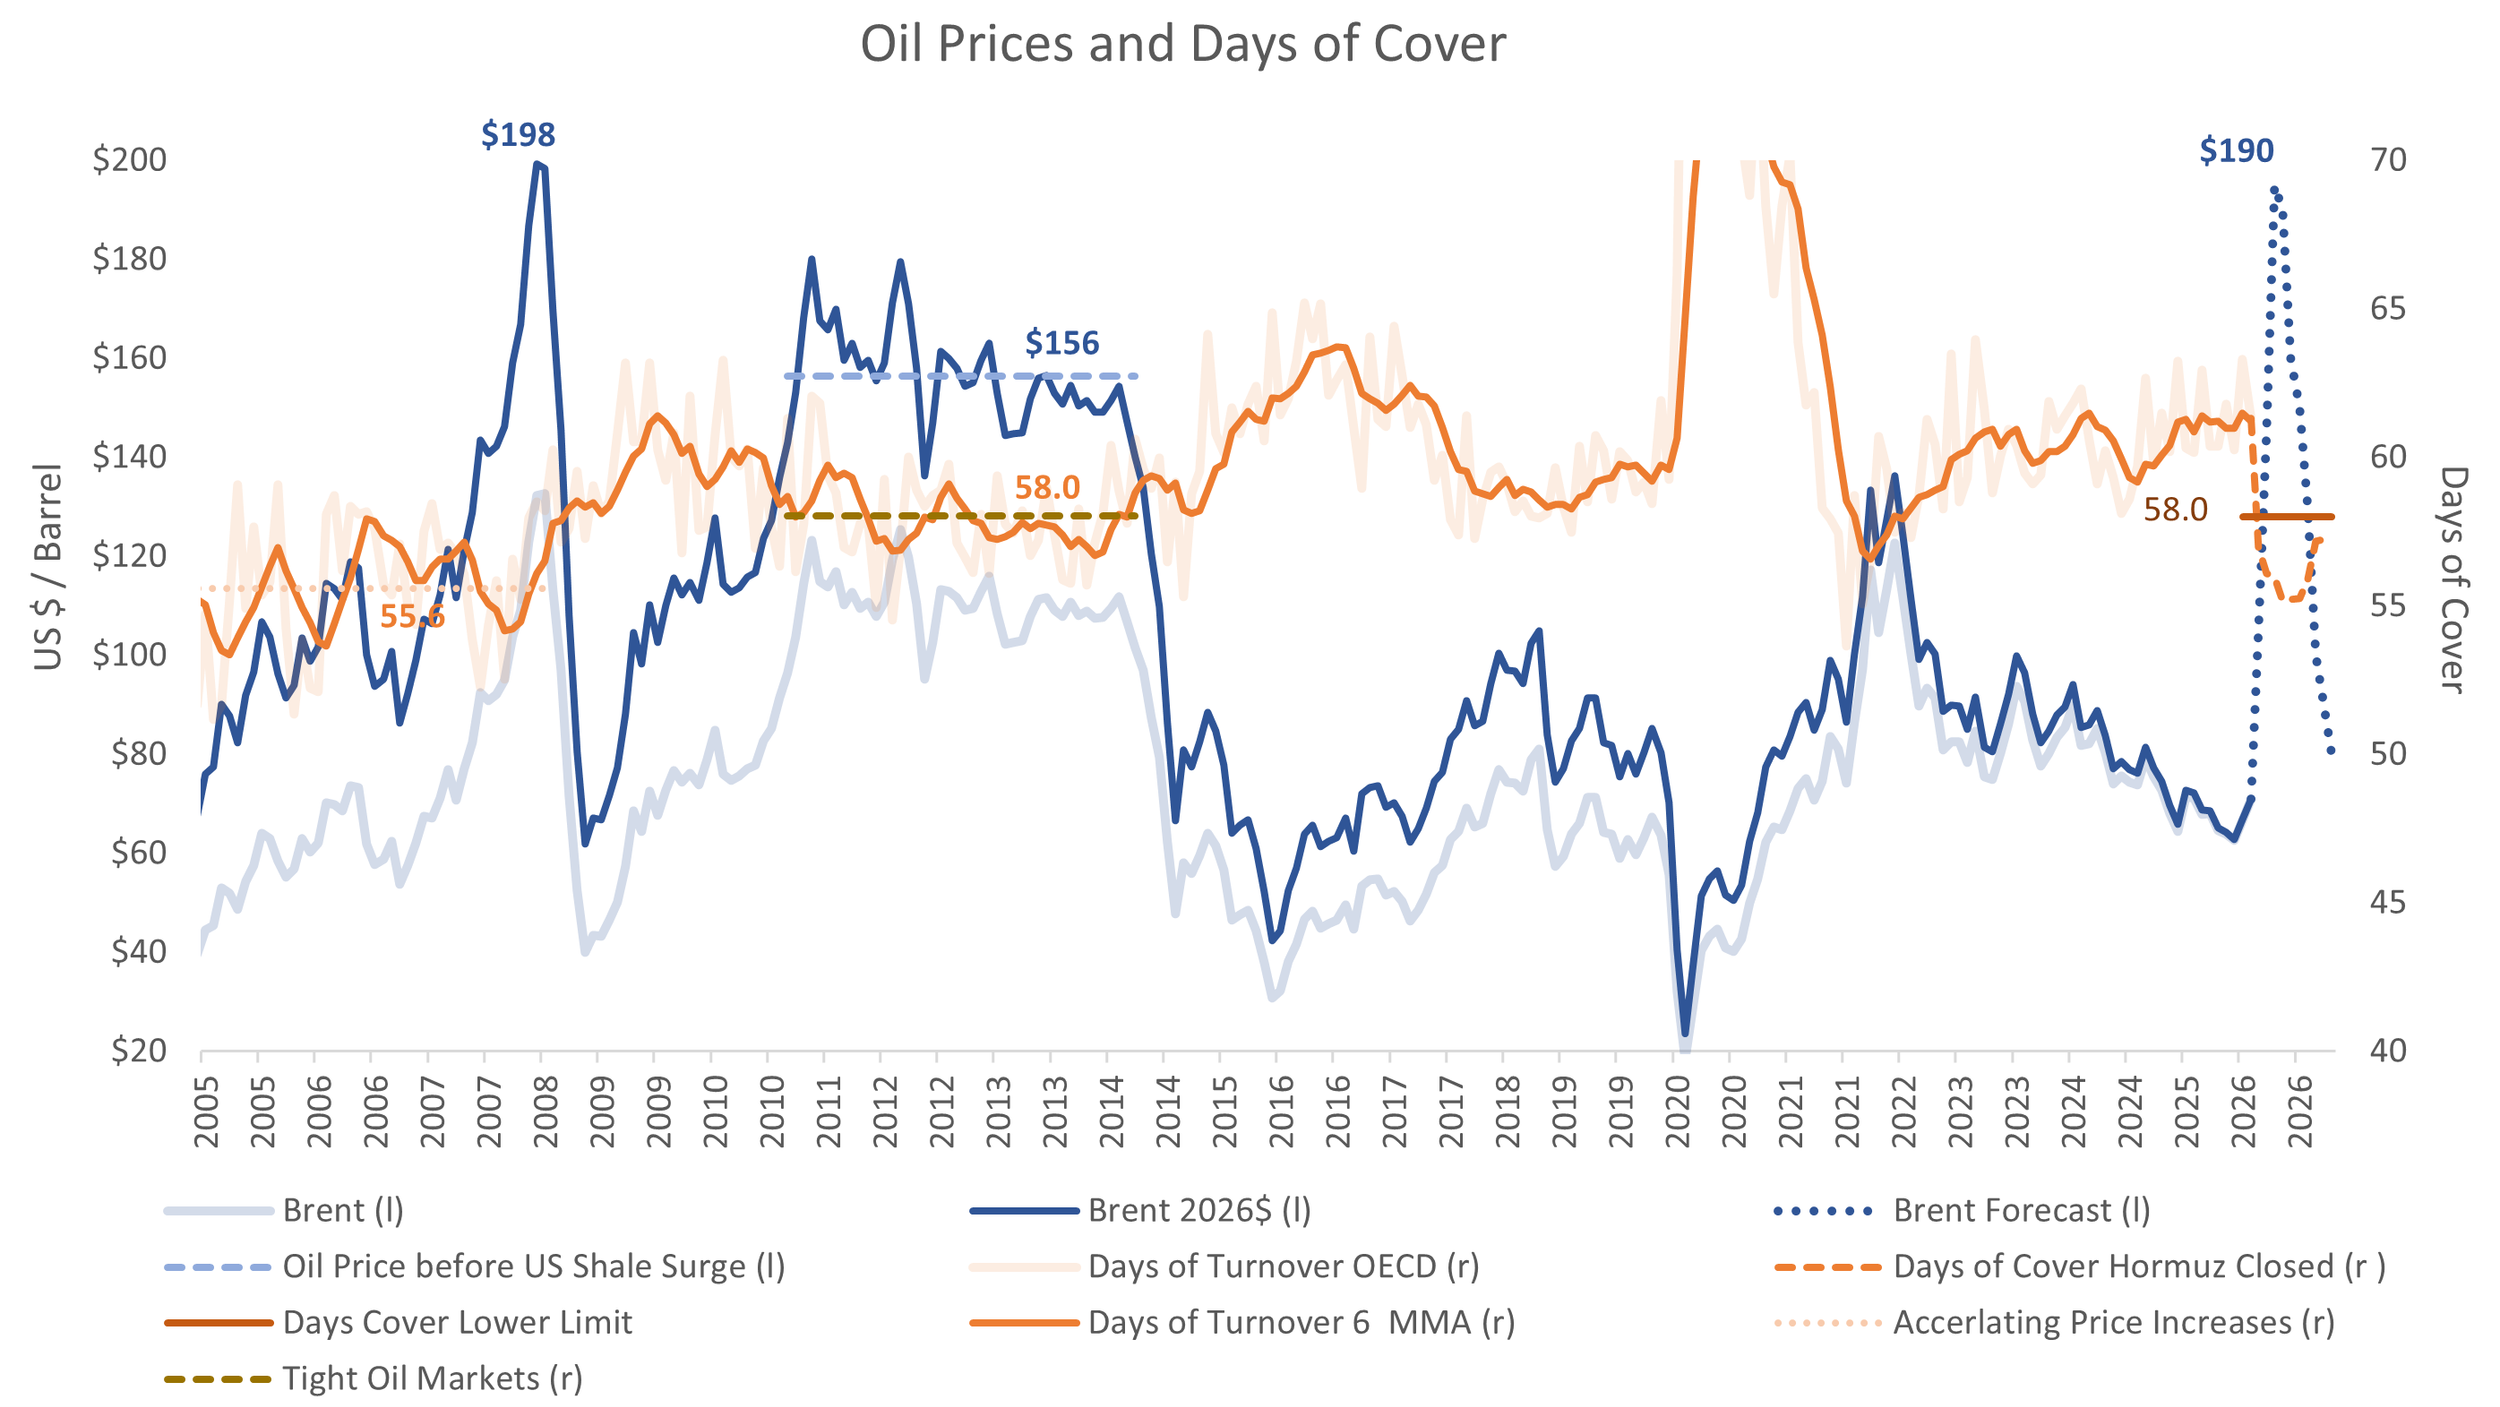
The 'shock' aspect refers to suddenness. In some cases, adjustment can be gradual. For example, oil prices were consistently high from 2011 to 2014, and OECD oil consumption fell gradually over that period. In the current episode, the US will have to cede 8% of its oil consumption in April alone, and almost 10% in May. Adaptation through efficiency gains over such a short period is impossible. Instead, people make do with less, and do so almost immediately. For that reason, oil shocks tend to be coincident with recessions. A sudden loss of oil immediately reduces economic activity, the very essence of a recession. Expect Europe to be in recession during April, and the US to be in recession by May.
Has the oil shock already started? Well, sort of.
Markets have three elements: supply, demand, and stocks (inventories). If supply decreases, markets can be balanced by reducing consumption or, alternatively, by drawing down stocks. So far, most of the adjustments appear to have come from inventory draws.
Of course, this cannot continue much longer. Our analysis suggests that advanced country (OECD) inventories will fall to about 57 days of cover by the end of the month. These are below customary level of 60 days for refiners and other oil market participants. Consequently, the window to sustain consumption through inventory draws is closing. By April, it will be effectively closed and adjustments will have to come from reducing consumption.
In Asia, the process has already started. Poorer countries like India, Pakistan and Bangladesh are curtailing refiners, extending school holidays and moving to work-from-home and four-day workweeks. Large-scale flight cancellations are beginning in long-haul markets like New Zealand.
These curtailments and cancellations will expand and spread to Europe by the end of the month. They will hit the US during April.
Oil Prices
It is not hard to find stories about US resilience to oil shocks because oil consumption is only a small part of GDP and therefore not a problem.
This misses the point. Global oil production will be down by 14% -- 14 mbpd – in April. This loss of supply must be allocated to consumers around the world in some proportion. Given that the US is 20% of global oil consumption, it will not be spared. All other things equal, we might assume US oil consumption will fall by its pro rata share, about 2 mbpd, or 10%.
The question is therefore the oil price necessary to reduce US consumption by 10% over 60 days.
While oil prices are high in recent terms, they are not particularly high by historical standards, nor are they high enough yet to materially dent consumption. For example, from 2011 to 2014, Brent averaged $110 / barrel—$156 / barrel in inflation-adjusted terms—and global consumption grew by 3%. Prices will need to go much higher to destroy demand.
We can estimate the necessary oil price by a few different means. The first is to look at historical oil shocks adjusted for inflation and growth of the US economy in the interim.
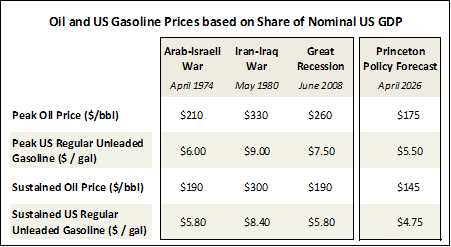
With these adjustments, we can look to three prior shocks for guidance, notably the first modern oil shock of the Arab-Israeli War in 1973-1974; the Iran-Iraq war during 1980-1982, and the oil shock of the Great Financial Crisis of 2008. Adjusted for inflation and GDP growth, these suggest oil prices in the range of $210-$330 / barrel at peak and a sustained price about $20 - $30 / barrel below that.
We can also estimate the price by surveying the public, even in small and informal samples. Those I have interviewed said they would curtail their driving by 10% if gasoline prices doubled. This suggests unleaded gasoline at $5.50 / gallon for the US average, and that is in fact our forecast for the end of April. This equates to $175 / barrel of crude oil, a bit below the historical peak for prior oil shocks.
Our average unleaded price for April is forecast at $4.50 / gallon. Given that unleaded averages $3.90 / gallon in the US at writing, $4.50 / gallon is not at all inconceivable.
Recession
Oil shocks and recessions are essentially synonymous. Reducing oil consumption reduces economic activity and a reduction in economic activity is a recession. In the data, they occur simultaneously.
Is a recession coming?
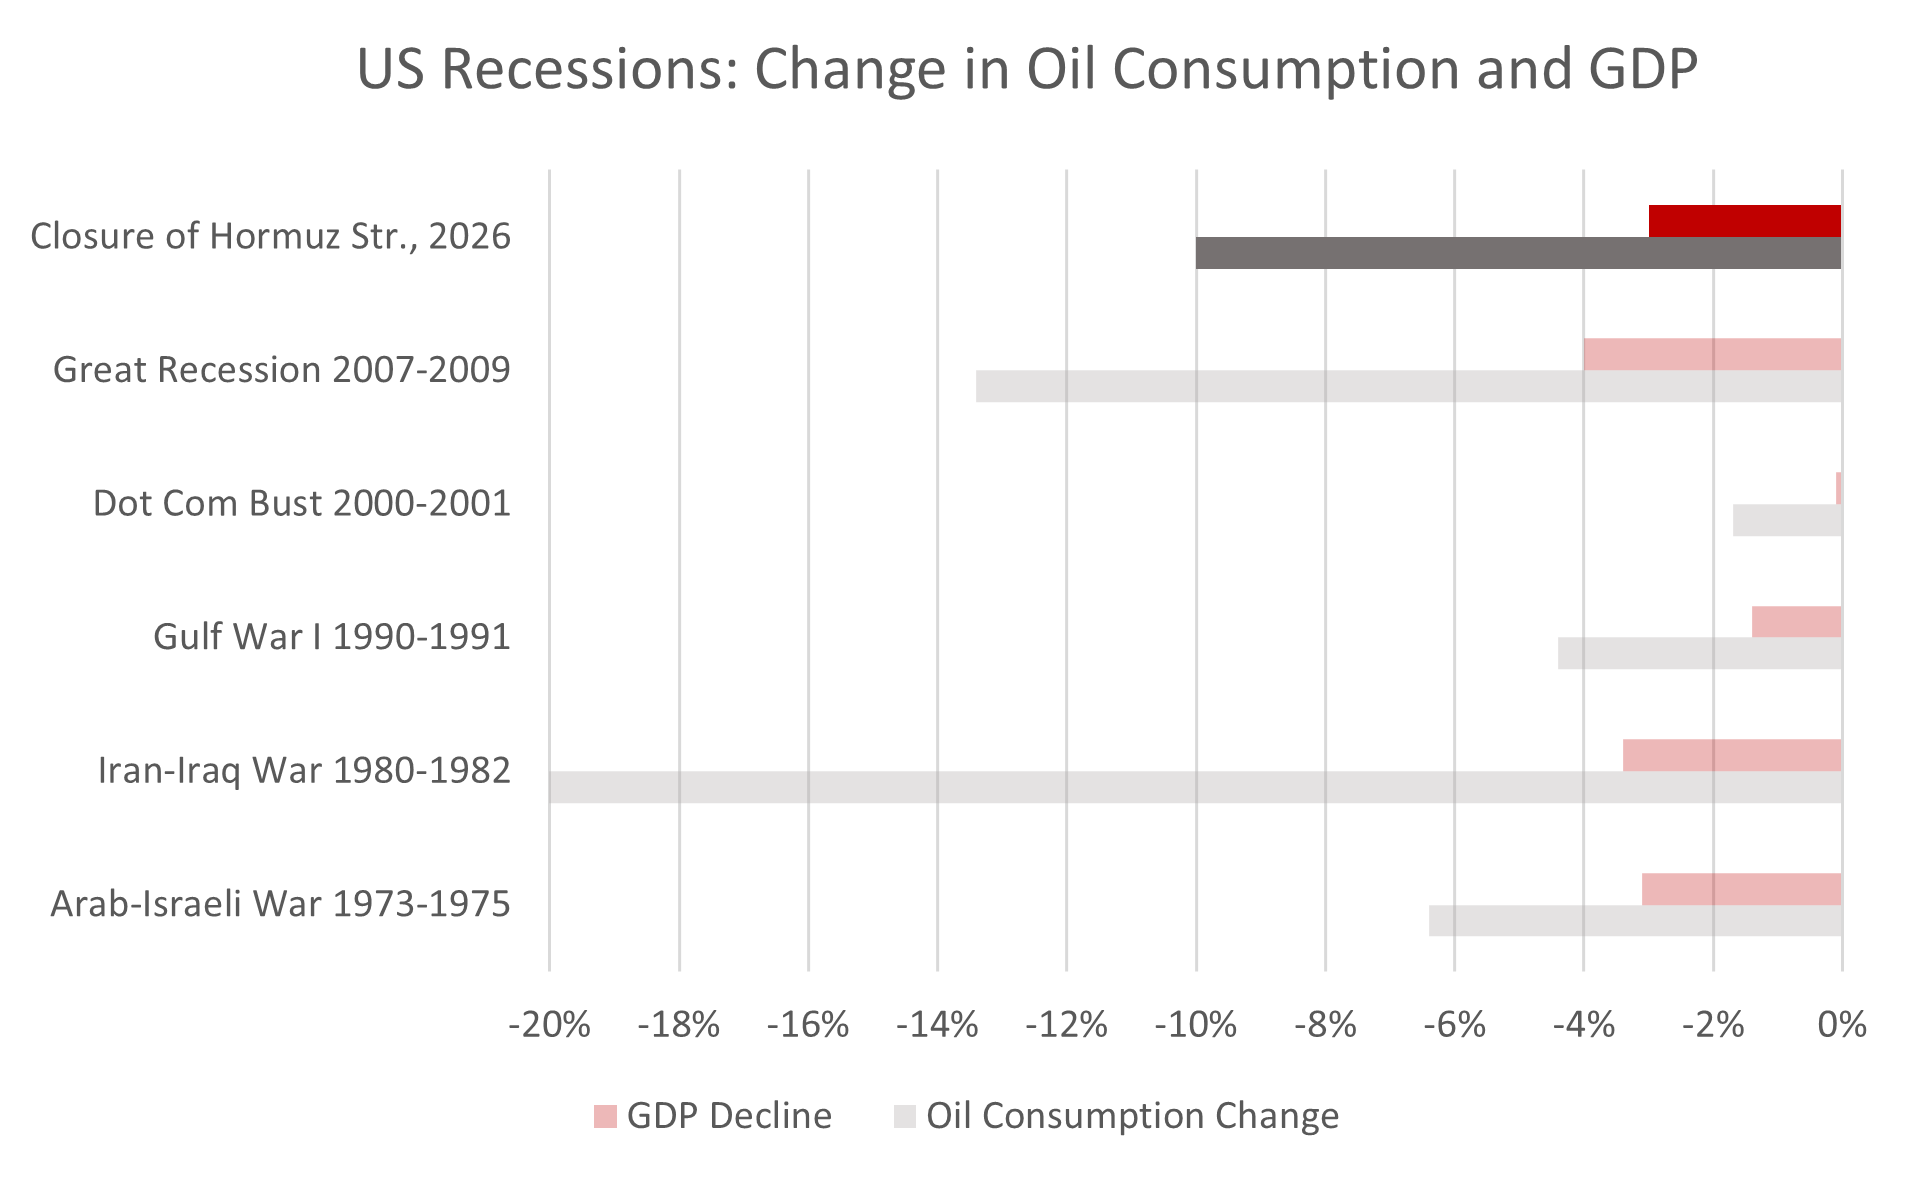
The short answer is ‘yes’. Historically, GDP has fallen by about a third of percentage decline in oil consumption. If we assume US oil consumption will fall by 10%, then we might expect a recession with a GDP decline of 3%. This is in line with prior oil shocks, particularly those of the 1970s, and a typical decline for recessions in general. The public will experience it as a stiff and unpleasant downturn. Recessions almost always are.
In any recession, the question is not only magnitude, but duration. How long could the coming recession last?
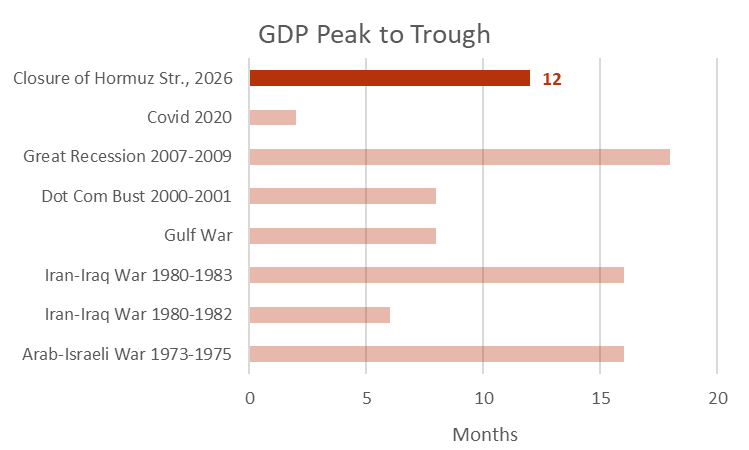
The recessions of the 1970s oil shocks – the best precedent for the current crisis – lasted 6 to 16 months from peak to trough, per NBER dating. We use the average of 12 months for our forecast. If the crisis continues unabated, expect the US to fall into recession during April and the economy to continue to deteriorate through March 2027.
Let me close with the customary disclaimers. Our forecast assumes that the Strait of Hormuz remains materially closed. It may open for any number of reasons, including successful US military action, the collapse of the Iranian regime and resistance, or policy decisions made by Iranian leadership.
Further, our timing expectations may be off, but probably not by much. In addition, the allocation of demand adjustments may prove more unequal than we expect. The US may require smaller, and East Asia, for example, may require proportionally greater adjustments than we project. Finally, these forecasts assume that the Saudi East-West Pipeline remains fully operational at 5.5 mbpd. The Iranians will likely try to put it out of action.
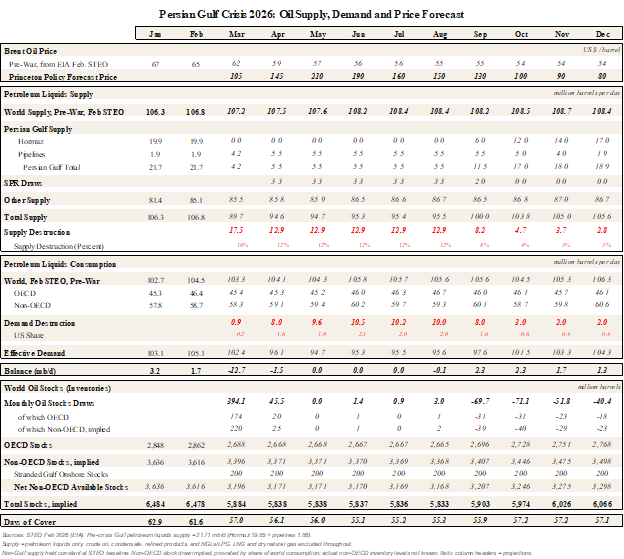
For those interested in our current quantitative model, here it is: