Ruble +8% on US dollar, Ukraine support eroding

Let's start with Price Cap metrics.  

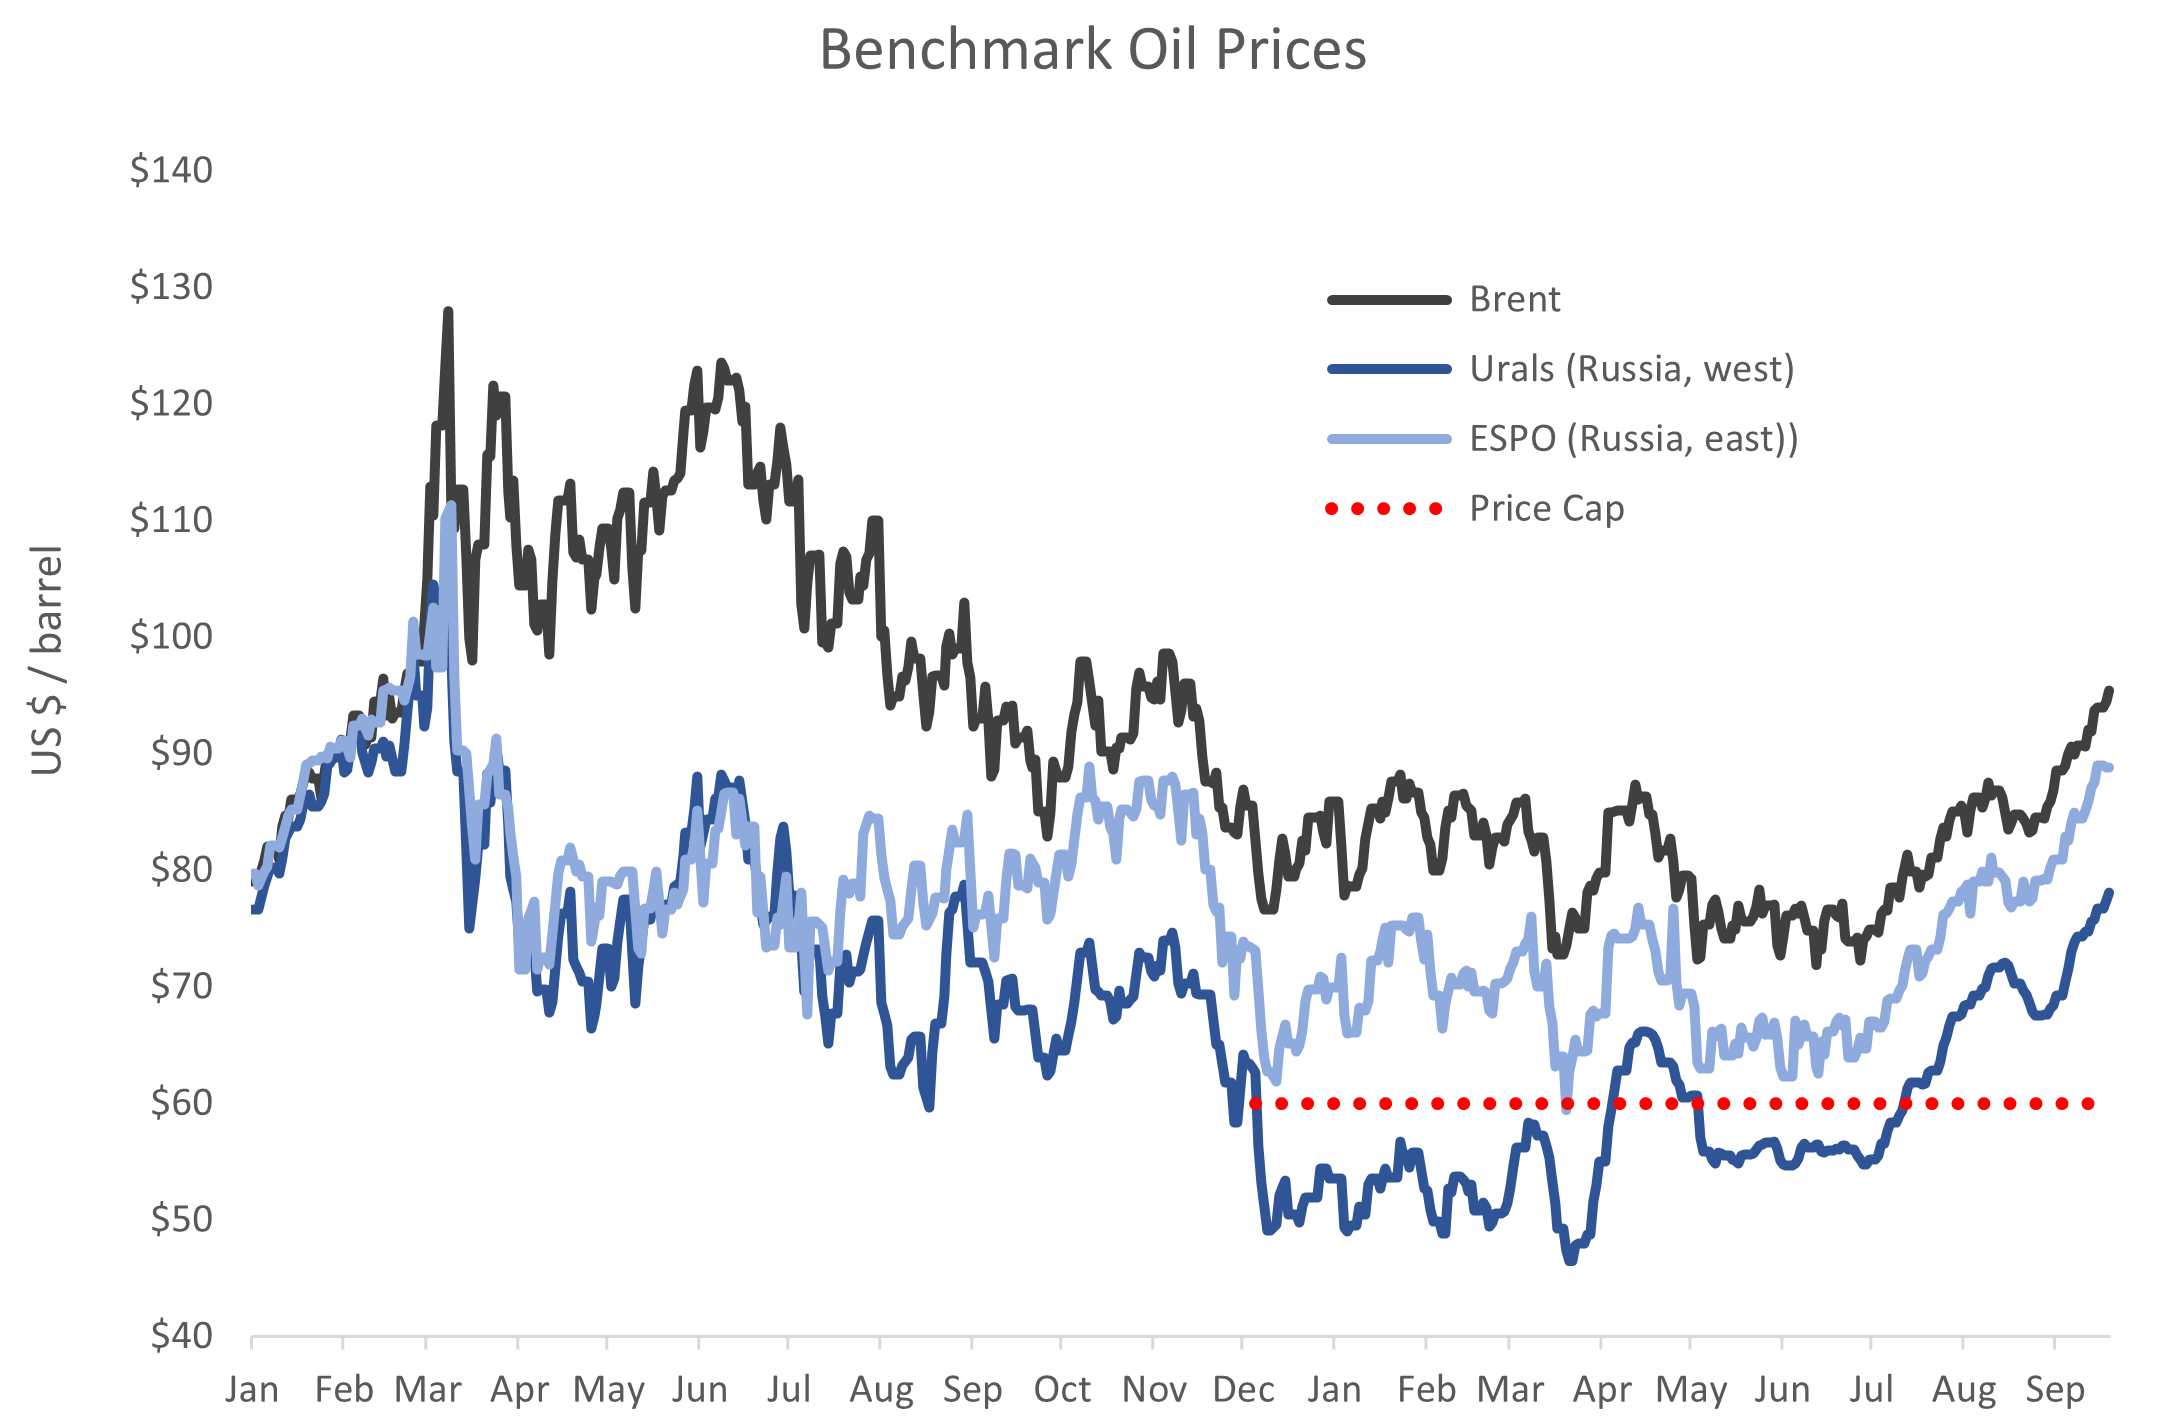
Brent and the Urals price had a ho-hum week, without material movement in either price.  Brent closed the week at $85 / barrel, and Urals at $74.  A wilting Brent is signaling weakness in the global economic outlook, but this happens from time to time without a broader downturn.  But not always.

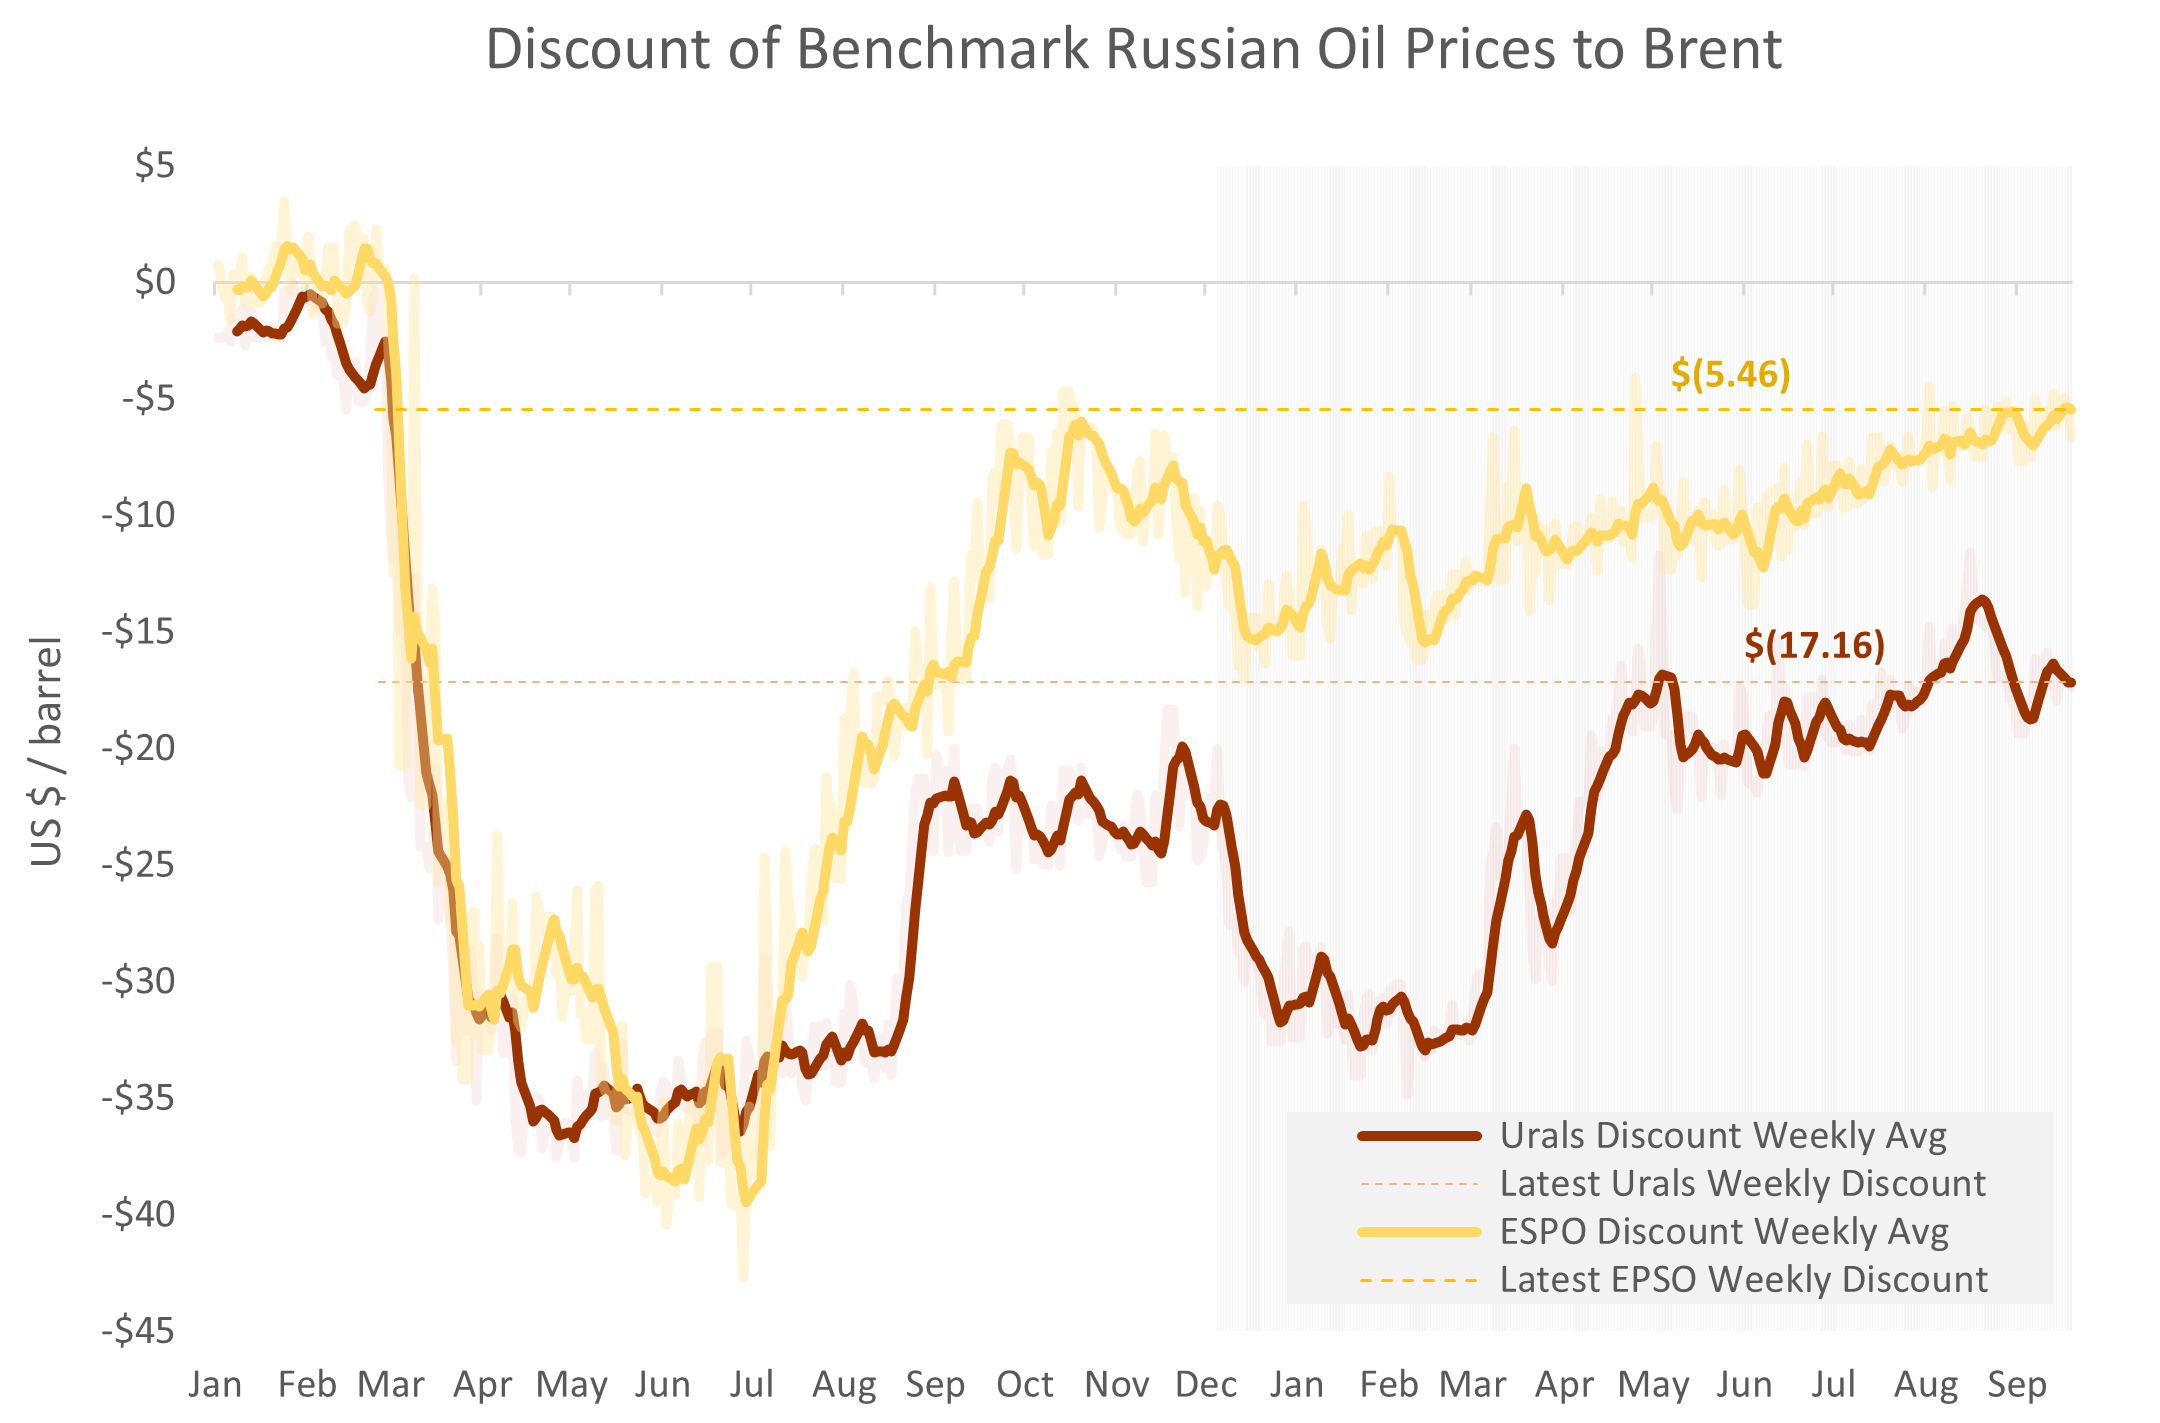
The Urals discount -- the difference between Russia's western crude oil export price and Brent -- continues to narrow, averaging $13.49 for the week and tightening by about $1 / barrel over the last month. Based on recent trends, expect the Urals discount to continue to decline by around $0.04 / day. 

The ESPO discount -- the difference between Russia's eastern oil export price and Brent -- also continues to narrow, now under $5 / barrel.  The ESPO discount may be expected to disappear entirely during the first quarter of next year.  

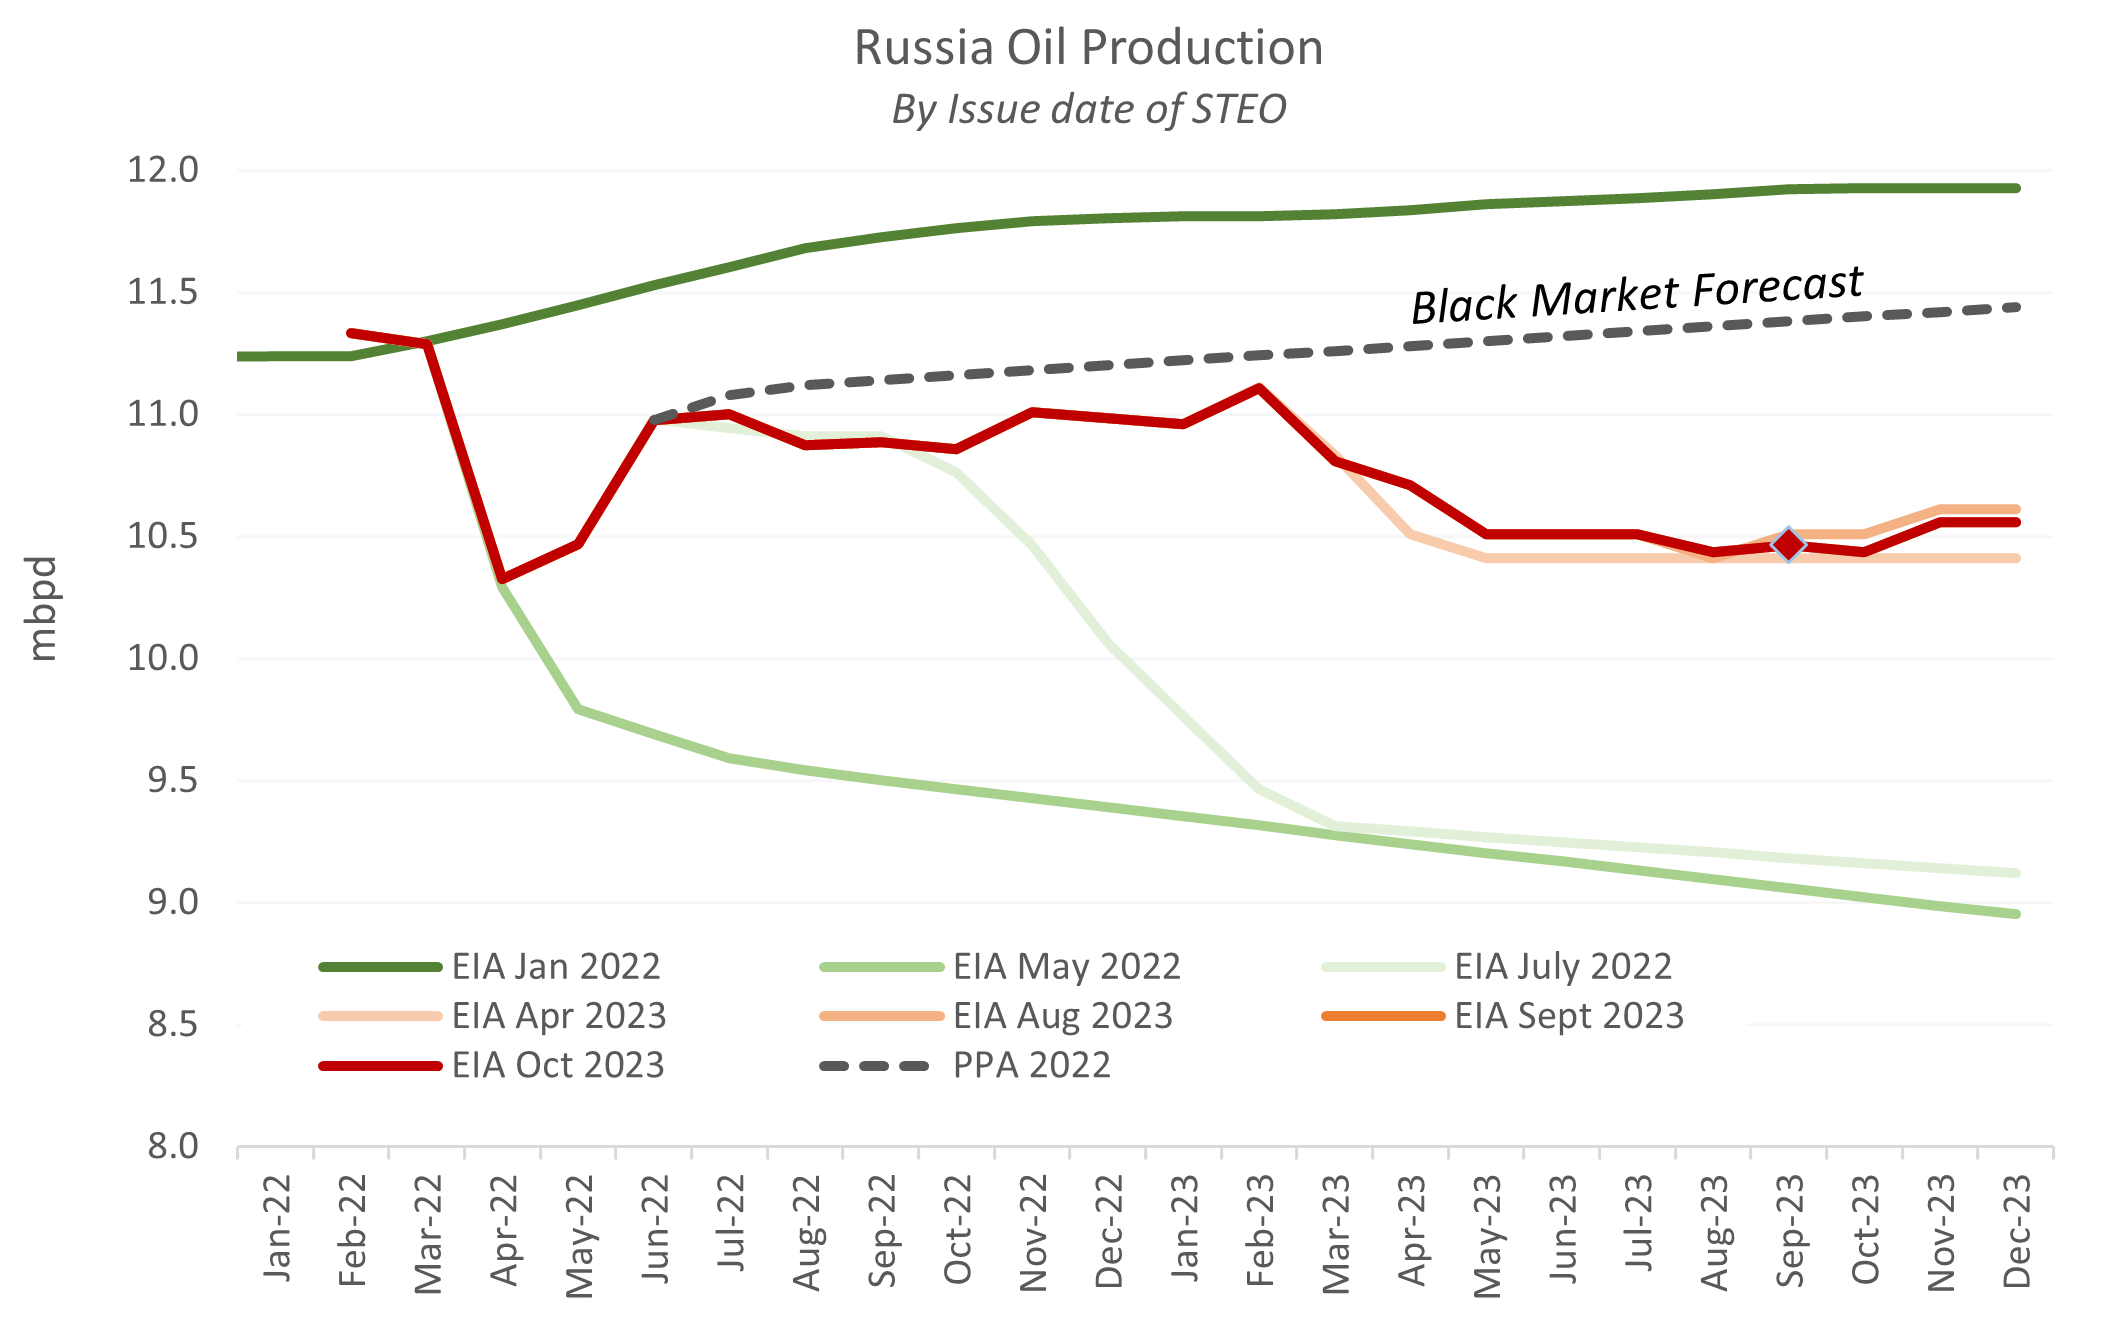
Bloomberg reports that Russia's seaborne crude exports averaged 3.7 mbpd last week, higher than the pre-war level and inconsistent with Russian promises to cut production.  Nevertheless, according to Reuters, Russia's energy ministry said on Friday that crude oil and petroleum products exports collectively are slated to fall in November by more than 300,000 barrels per day (bpd), compared to the average level in May-June.

This past week, Russia's central bank hiked a key interest rate to 15%, up from 13%.  The bank blamed higher-than-expected inflation.  Readers will recall that I indicated increases in Russia's money supply were consistent with 20% inflation.  Easy money appears to be propagating through the system, hence the rise in inflation.  The Bank has stated that it is anticipating 7% inflation for 2023.  This seems implausible.  Russia's central bank probably uses some version of the Taylor Rule, which would imply inflation in the 12-14% range for a 15% interest rate.  At a guess, Russia's true inflation rate is twice the figure claimed by the central bank.

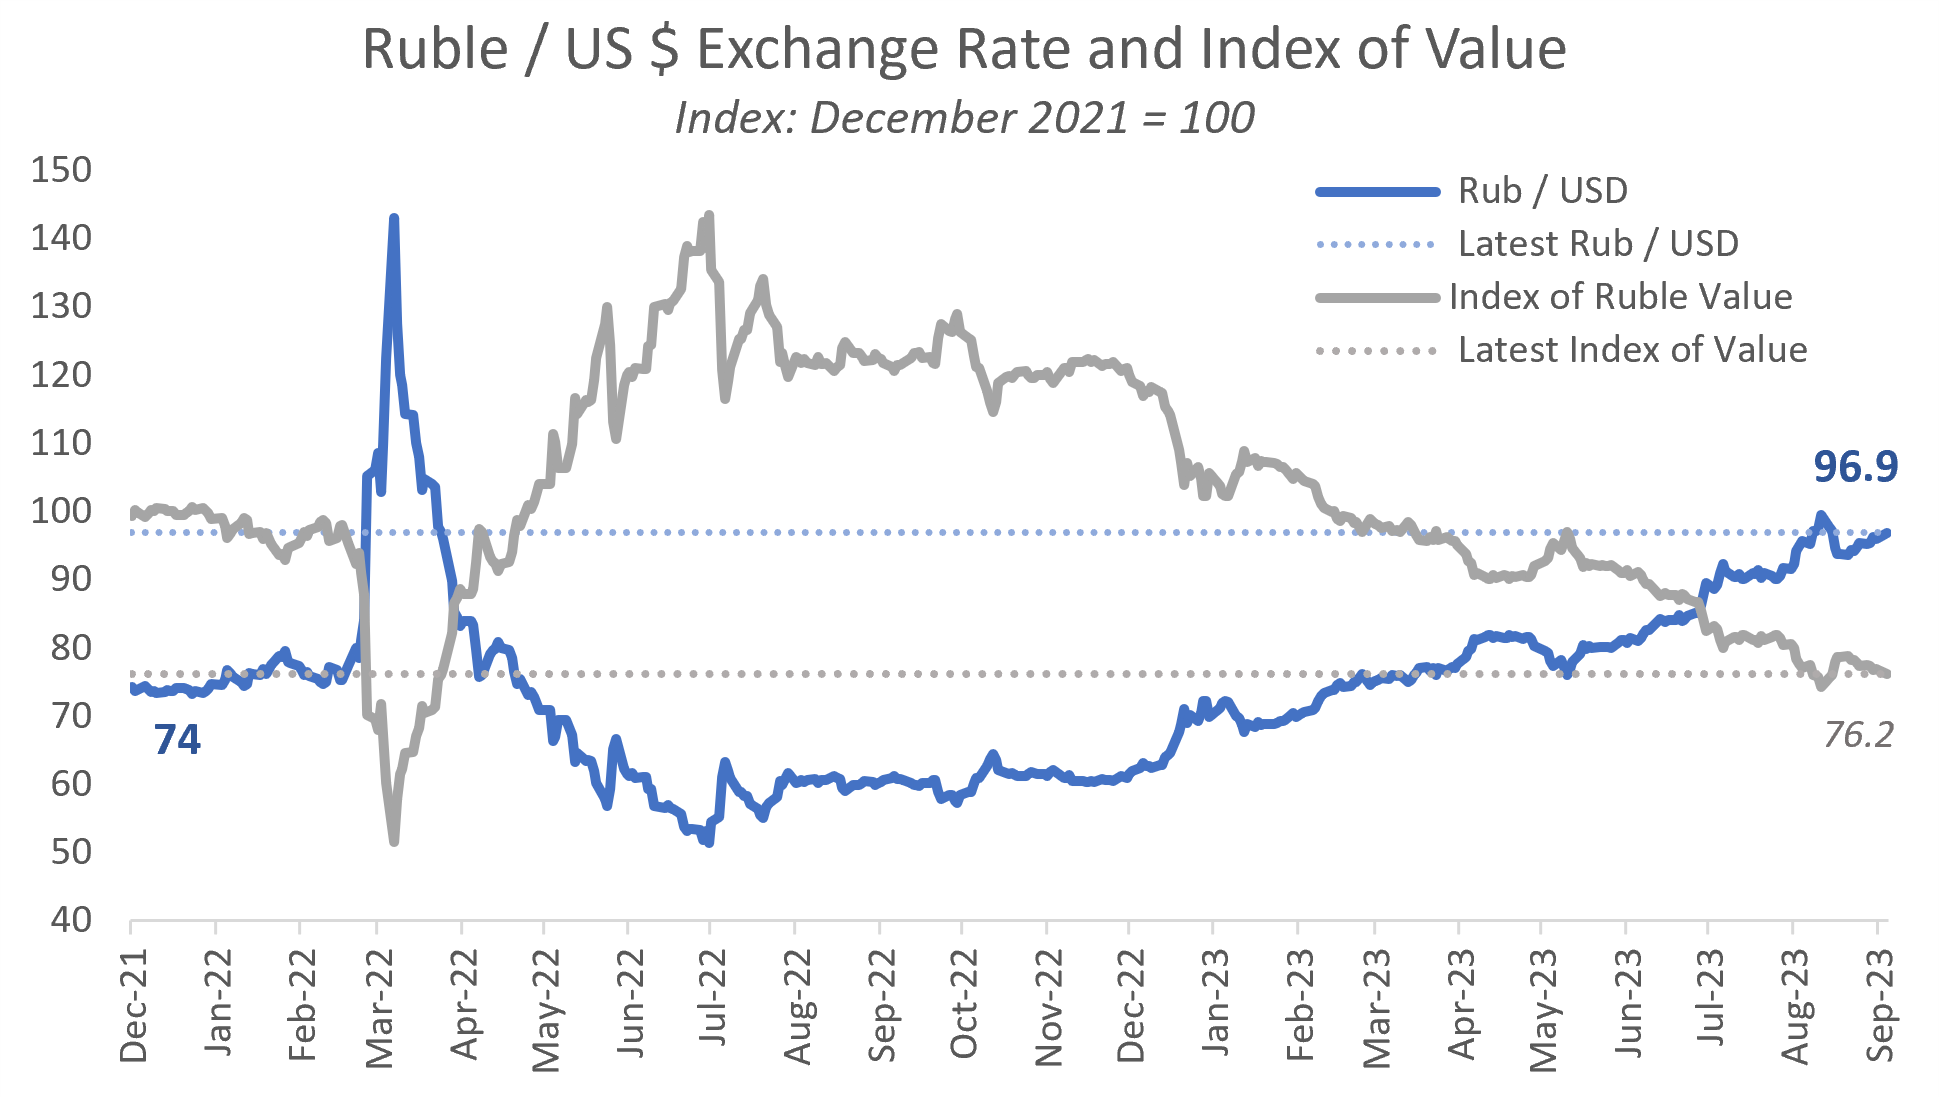
Ordinarily, high inflation should lead to currency devaluation, but in fact, the ruble has appreciated by 8% on the US dollar in just the last few weeks.  This is in part due to rising Russian interest rates, but also attributable to the collapse of the Price Cap and Russia's blended oil export price holding near $80 / barrel.  Thus, Russia faces disparate trends, with elevated domestic inflation contrasting with substantially improving terms of trade internationally.  I had stated earlier that I thought late summer hype about a collapsing ruble was likely overstated, and so it proved.  Should Brent resume its rise, expect the ruble to appreciate further.

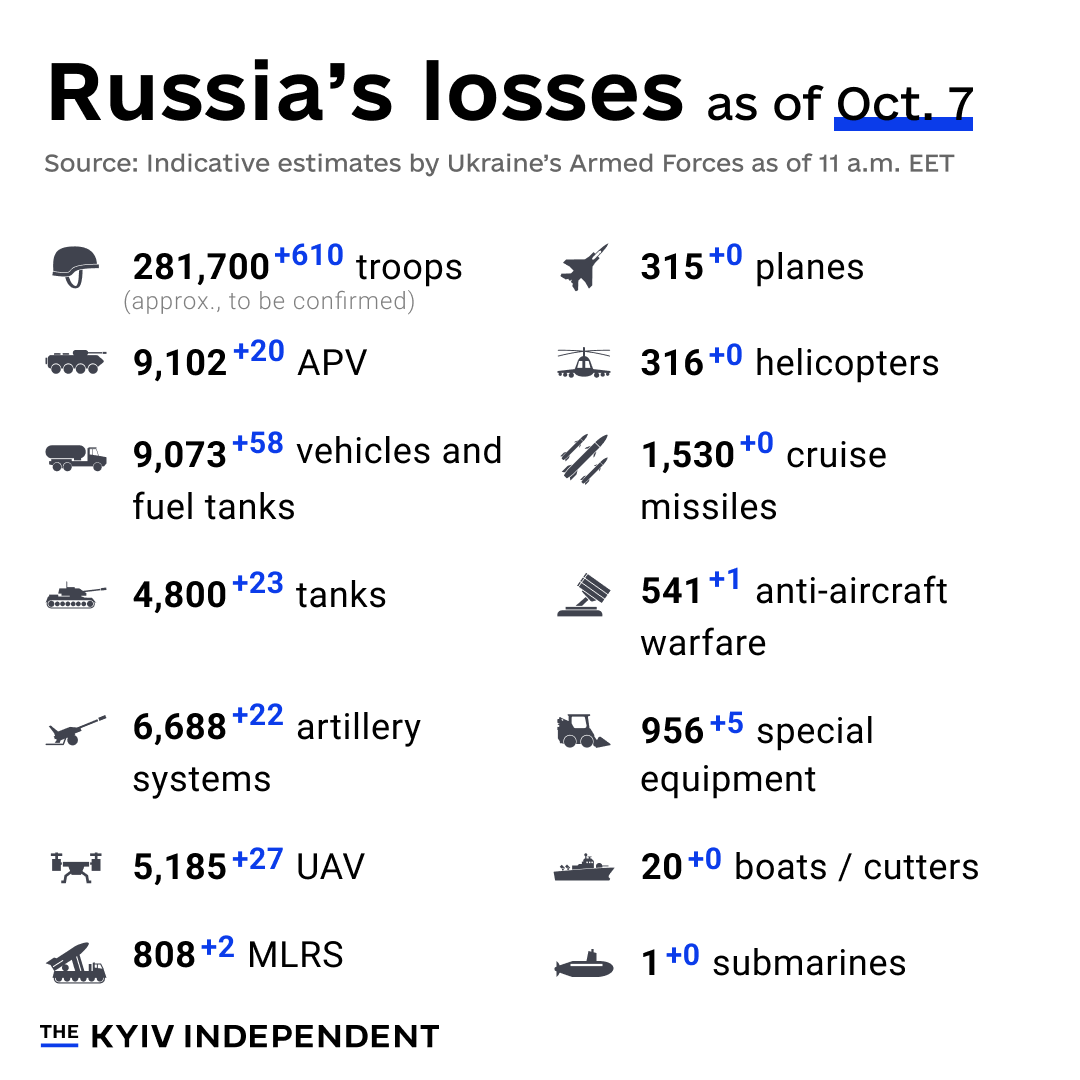
Finally, a newly released Gallup poll shows ebbing support for Ukraine in the US.  A majority still supports Ukraine, but clearly, disappointment with a lack of material progress during the summer campaign has taken the wind out of the public's sails.  Kyiv needs a rethink on financial and messaging strategy, and right now, the surreal passivity of the Ukrainian bureaucracy and Zelenskyy's inner circle is impeding action on these fronts.

Rigs and Spreads Nov. 3: The light in the tunnel was a train after all

  • After three weeks of modest gains, rig counts have resumed their decline, giving back all their gains in just this past week

  • Rig counts

    • Total oil rig counts: -8 to 496

    • Horizontal oil rig counts: -8 to 443

    • The Permian horizontal oil rig count: -4

    • The Canadian horizontal oil rig count saw progress this week, +1 to 120, but still is 16 below this week last year

  • The US horizontal oil rig count is falling at a pace of -0.5 / week on a 4 wma basis.

    • This number has been negative for 46 of the last 48 weeks

  • Frac spreads fell, -5 to 270  

    • As last week, there is a stark mismatch between rigs and spreads, with DUC inventory, as measured in days of turnover, falling to a nine-year low of 13.6 weeks

  • The rig / spread relationship remains highly unstable

    • To attain stability in the DUC count, rigs must either rise by 83 or spreads must fall by 42.  

    • Given that rig counts are falling at an implied WTI price above $90 / barrel, a rapid roll-off of spreads seems likely at some point

  • Interestingly, the Brent Spread (Brent – WTI) opened back up to $4+ / barrel in the last two weeks

    • An open spread has implied US production growing faster than Brent zone production, compelling US operators to offer a modest discount to place incremental barrels in the market

    • Historically, this spread is associated with US production growth around 400 – 600 kbpd / year

    • If that remains true, then EIA pessimism on US short-term C+C growth is misplaced

Rigs and Spreads Oct. 27: A Clear Trough


A clear trough has emerged, and rig counts are rising, if slowly

  • Rig counts

    • Total oil rig counts: +2 to 504

    • Horizontal oil rig counts: +2 to 451

    • The Permian horizontal oil rig count: +2

    • The Canadian horizontal oil rig count saw progress this week, +1 to 119, but still 19 below this week last year

  • The US horizontal oil rig count is rising at a pace of +1.0 / week on a 4 wma basis.

    • This number is positive for the first time in 48 weeks

  • Frac spreads rose, +6 to 275  

    • Even more than last week, there is a stark mismatch between rigs and spreads now, with DUC inventory, as measured in days of turnovers, falling to a nine-year low of 13.9 weeks

    • The rig/spread relationship is even more unstable than I noted last week.  To attain stability in the DUC count, rigs must either rise by 84 or spreads must fall by 43.  

  • If the breakeven to add rigs of $83 holds, then we should see appreciable rig additions in the coming weeks.

    • On the other hand, if rig counts fail to show material signs of life (cc +4 hz rigs per week), then we may be seeing the last hurrah of the US shale sector, with operators running down DUC inventories like an alcoholic taking a last drink before entering rehab.  

Rigs and Spreads Oct. 20: Reaching a bottom?

Rigs counts once again saw a glimmer of hope this week.

  • Rig counts

    • Total oil rig counts: +1 to 502

    • Horizontal oil rig counts: +0 to 449

    • The Permian horizontal oil rig count: +1

    • The Canadian horizontal oil rig count saw a solid progress this week, +4 to 118, but is still 17 below this week last year

  • The US horizontal oil rig count is falling at a pace of -0.5 / week on a 4 wma basis.

    • This number has been negative for 46 of the last 47 weeks

    • If the rig count change is zero or higher next week, then the 4 wma change in rig counts will turn positive for the first time in 11 months

  • Frac spreads rose, +6 to 269  

    • There is a stark mismatch between rigs and spreads now, with DUC inventory, as measured in days of turnovers, falling to 14.3 weeks.  This the lowest since the early days of the shale revolution

    • The rig/spread relationship is now clearly unstable

      • To attain stability in the DUC count, rigs must either rise by 75 or spreads must fall by 38.  This is the most distorted this number has been since the height of the pandemic.

      • If the breakeven to add rigs of $83 holds, then we should see appreciable rig additions in the coming weeks.

      • On the other hand, we have only two weeks of positive data on rigs, which could easily prove a false dawn.  If that’s the case, then at some point, spreads will start to fall off dramatically

  • The EIA issued the October DPR this past week

    • In the October report, September crude and condensate production from key shale plays fell to 9.47 mbpd, down 34 kbpd from August.

    • However, total August C+C shale production was revised up a whopping 237 kbpd, and the May-August period was revised up by an eye-popping 182 kbpd on average

    • Having said that, revisions have been so large lately that my confidence in reported numbers is at a low at present.  

    • As I noted last week, the EIA has been on a revision spree lately – which happens sometimes – but it does make the data hard to interpret, and reliable month-to-month comparability may not be restored until early next year.


Rigs and Spreads Oct. 20,pdf

Urals rebounds; renewed emphasis on Cap enforcement; Gaza partition

Oil Prices

Brent was choppy last week, partially recovering from the prior week's sell-off.  At writing, Brent was trading at $90 / barrel.  The Biden administration, as reported by Reuters, announced sanctions on owners of tankers carrying Russian oil priced above the G7's price cap of $60 a barrel, one in Turkey and one in the United Arab Emirates.  Brent promptly soared by $5 / barrel.  

Urals is holding near $76, $16 above the Cap.   ESPO, Russia's principal eastern oil export price, was last reported at $86.  

The Urals discount, the difference between Russia's western crude oil export price and Brent, opened back up to $14, as we had expected.

The EIA reports Russian oil production for September largely unchanged around 10.5 mbpd, 0.8 mbpd lower than its pre-war level.  No further declines are expected.

S&P Global estimates that Russia's seaborne crude oil exports are largely unchanged since the start of the war, and up a bit in September.  China and India remain key buyers.

S&P Global has also made estimates of Russia's seaborne crude exports by type of carrier and pricing regime.  The results are somewhat surprising.  Only 57% of Russia' seaborn crude exports fall into the Urals pricing zone.  A hefty 43% of exports are to the east and, to appearances, not subject to the Price Cap, whether carried on western or non-western tankers.  Of Russia's western Urals trade, only 54% is carried on western tankers, that is, those subject to the Price Cap.  Overall, only 31% of Russia's seaborne crude trade is both subject to the Urals price and carried by western tankers.  That is, only one-third of Russia's seaborne crude exports are subject to the Price Cap, although this expands to 45% if all eastern trade carried by western tankers, is included.  

At this point, therefore, we can claim that the Price Cap mechanism is riddled with holes, even assuming that the Price Cap were enforced and effective on the Urals trade carried on western tankers.  Readers know that I have been harshly critical of the Price Cap, even months before it was implemented.  We now have an additional reason: the Biden administration's analytics (including those of the Fed and Treasury) were weak.  This, coupled with a technically deficient structuring of the Cap, has led to enforcement better described as nominal than substantive.

Hamas, Israel, and the Partition of Gaza

The majority of Ukraine watchers have weighed in on events in Gaza.  I will take similar liberties.

The press and media commentators continue to refer to Hamas militants as terrorists, and certainly, the description is apt.  Nevertheless, an invasion of 1,000 Hamas fighters killing more than one thousand Israelis is not a terrorist act.  It is an act of war. The term 'terrorist' creates the impression that Hamas fighters were somehow an extremist, splinter group, acting without the approval or support of Gaza's government and against the will of Gaza's population.  This is untrue.  The attack was planned by Hamas and justified by its military chief, Mohammed Deif, as a response to "Zionist colonial occupation".  The assault on Israel was a policy decision of and implemented by the government of the Gaza Strip.

The degree of public support in Gaza is a more nuanced question.  Hamas won Palestinian elections in January 2006, and no open elections for the government of the Gaza Strip have been held since.  Hamas remains in charge.  Palestinian opinion polling from this past summer suggests that Hamas would have won an election there prior to the attack on Israel.  Nevertheless, a Washington Institute poll from July 2023 concludes that, while a "majority of Gazans (65%) did think it likely that there would be “a large military conflict between Israel and Hamas in Gaza” this year, a similar percentage (62%) supported Hamas maintaining a ceasefire with Israel."  Did the Palestinians in Gaza support the attack on Israel?  Condemnation by Palestinians of the attack on Israel has been muted to non-existent.  The polling data suggests that many Gazans support violent confrontation, but perhaps not a majority.  Reuters reports that US Secretary of State Blinken said he knew that Hamas did not represent the Palestinian people or their legitimate aspirations.  The polls say otherwise.

A terrorist act that kills a dozen victims will prompt a limited response, for example, the targeting of leadership with precision airstrikes or commando raids to free hostages.  The murder of one thousand civilians falls into an entirely different category.  The US treated the 9/11 attacks, which killed 3,000, as acts of war and invaded and conquered two countries as a result.  The 1,400 Israeli victims would represent nearly 50,000 deaths in the US, adjusted for population.  Like the US after 9/11, Israel will treat the recent attacks as acts of war by the government and people of Gaza, not merely one-off acts of terrorism by lone-wolf extremists.  

Unlike the US, which invaded Afghanistan and Iraq purely as disciplinary measures without the intent to take land, Israel will take land over punishment.  Israel cannot invade the Gaza Strip and govern it as the US did Iraq and Afghanistan.  In Gaza's dense, urban environment, the risks and complications are unpalatable.  Instead, both opportunity and necessity drive Israel to take territory.  By attacking Israel on such a large scale, Hamas has opened the door for Israel to seize land which conservative Israelis consider organic to greater Israel.  Such an opportunity may occur only once or twice in a century, and it may not be wasted.  Further, Israel's failure to detect and counteract the Hamas incursion represents a catastrophic failure of leadership.  By any reasonable measure, Prime Minister Benjamin Netanyahu's career should be finished.  His only saving grace could be the annexation of a substantial portion of the Gaza Strip.  This would make fallen Israelis not victims, but soldiers and martyrs whose blood has secured Israel's historic lands.   It may just redeem the Prime Minister's reputation.  As a political necessity, therefore, Netanyahu must seize part of Gaza.

Plans are being implemented.  The first step is to clear north Gaza, including Gaza City, of its Palestinian inhabitants.  The expulsion of the local population is well underway.  Further, every edifice in north Gaza will likely be razed to prevent talk of return, ever.  This, too, is already in process.  Finally, a new border must be designated, and one has been: the Besor Stream in the Wadi Gaza, about halfway down the Strip.  If north Gaza is cleared of its Palestinian population, its structures destroyed and the rubble cleared; and if only Israeli Defense Forces remain beyond the wall to be constructed north of the Wadi Gaza Reserve, then Israel will have annexed half of Gaza as a practical matter.   

Source: ABC News

One can only wonder at the sheer stupidity of Hamas.  Their plans for the first day of the war are clear.  What did they expect on Day 2?  Did they think that killing 1,400 Israelis would be a freebie?  Had they no notion that such an act of war would prompt Israel to seize land?  Whatever they were thinking, the reality will likely be the loss of half of the Gaza Strip to the State of Israel.

For just this reason, President Biden would do well to refrain from visiting Israel just now.  If the Hamas attack on Israel resembles 9/11, the Israeli response will constitute another Nakba (catastrophe), the destruction of the Palestinian society and homeland in 1948, and the permanent displacement of a majority of the Palestinian Arabs.  The seizure of north Gaza by the Israelis will pass into the Palestinian and Arab narrative of historical victimhood as yet another act of merciless aggression by Israel, and so it will be. Nevertheless, the attack on Israel creates both the opportunity and necessity.  President Biden's presence there will imply US endorsement of what is to come and may stain America's reputation for decades.  The President should stay away from Israel until the worst has passed.

Rigs and Spreads Oct. 13: Best week for rigs since last November

Rigs and Spreads

  • Rigs counts saw their best week since last November

    • Total oil rig counts: +4 to 501

    • Horizontal oil rig counts: +4 to 449

    • The Permian horizontal oil rig count: +1

    • The Canadian horizontal oil rig count saw a bit of life this week, +8 to 114, but still 26 below this week last year

  • The US horizontal oil rig count is falling at a pace of -2.5 / week on a 4 wma basis.

    • This number has been negative for 45 of the last 46 weeks

  • Frac spreads rose, +3 to 263  

    • As earlier, this is still too high for the current rig count, as DUCs continue to fall.  

    • To hold DUCs steady, the spread count must fall by 27

US Crude and Condensate Production Revisions

  • The most interesting news this week was EIA revisions to US crude and condensate production.in both the monthly STEO and weekly PSR 

    • US crude and condensate (C+C) production has been revised up 400 kbpd in the October STEO.

    • This changes the production narrative, as it shows almost unbroken growth from Jan. 2022 to Sept. 2023, with growth averaging about 1 mbpd / year despite falling rigs counts since last December

Since August 2022, a gap had appeared between US C+C production as reported in the weekly PSR and the monthly STEO (bottom graph).

  • As a result of this gap and the upward revision per the monthly STEO, the weekly C+C numbers have been revised up 1 mbpd in the last two months, bringing the PSR and STEO C+C numbers back into alignment (red circle, graph below)

  • This is a very large revision, but sometimes that's how it goes.  It does make the data harder to interpret.

The latest STEO (top graph) also shows US C+C production peaking last month.

  • Given the strength of trend to that point, a near term decline would seem less likely

  • Therefore, an upward revision of Q4 C+C numbers seems quite plausible

  • On the whole, however, the EIA sees US production peaking, which seems probable given on-going declines in rig counts, but timing is uncertain.

Rigs and Spreads Oct. 6: The Permian leads down

  • The Permian led rig declines this week.

  • Rig counts

    • Total oil rig counts: -5 to 497

    • Horizontal oil rig counts: -2 to 445

    • The Permian horizontal oil rig count: -2

    • The Canadian horizontal oil rig count had a bad week, down 8 to 106 and 33 below last year for the week

  • The US horizontal oil rig count is falling at a pace of -3.5 / week on a 4 wma basis.

    • This number has been negative for 44 of the last 45 weeks

  • Frac spreads rose, +5 to 260  

  • As earlier, this is still too high for the current rig count, as DUCs continue to fall.  

    • To hold DUCs steady, the spread count must fall by 26

  • Exxon is reportedly making an offer for shale leader Pioneer

    • The absorption of Pioneer into an established player like Exxon would once again mark the end of the shale revolution

Urals to $70, Ruble to 100 in Market Panic

Oil markets saw a big sell-off this past week.  Brent dropped by nearly $10 / barrel on high interest rates and Wednesday's Department of Energy (EIA) report showing US gasoline consumption collapsing, leading to a panic over the possibility of a global recession.  Pencil one in, but probably not yet.  US employment remains strong, and both diesel and jet fuel demand in the US are robust.  Oil prices merited a reset after nearly three months of secular gains, and while they may retreat a bit more from current levels, Brent and Urals should begin to climb again as sentiment stabilizes.

For the moment, however, Russian oil prices have followed Brent down with a $10 / barrel decline.  We estimate Urals closed the week around $70, with hard data available only through Wednesday.  

The Urals discount narrowed this week to under $12 / barrel, but the number is probably an artefact resulting from delays in reporting Russian oil prices.  Figure a $14 - $16 / barrel discount re-emerging when Brent stabilizes.

The ruble once again fell to more than 100 / USD, closing the week at 100.4 rubles / USD.  Investors typically flee to the US dollar during panics, and therefore one should avoid reading too much into the current ruble exchange rate.  Assuming capital markets regain their composure, the ruble might crawl back to the 96-98 / USD range over the next week or so.

Overall, the week was marked by panic in markets and chaos in the US Congress, prompting fears of funding gaps for Ukraine.  I will refrain from lecturing about funding shortfalls and the Price Cap this week.  Instead, I refer my readers to the pace at which Ukrainians are destroying Russian equipment.  Assuming Ukraine Defense Ministry numbers are broadly accurate, the Ukrainians are eliminating Russian equipment on an industrial scale with manufacturing-line routine.  Today's numbers are all but spectacular and not too far removed from those of the last several months.

Urals breaks $80; failed Price Cap funds surge in Russian war spending

As expected, Urals broke through the $80 barrier, closing on Friday at $80.21.  Brent ended the week at $92, with the US benchmark WTI at $91.  This is the closest WTI has been to Brent in some time and likely signals the end of the shale revolution.

Brent has risen by $22 / barrel in the last three months.  We last saw such surges in 2008 before the Great Recession and 2011, leading the EU into a brutal, near two-year recession.  A replay is likely this time as well, but oil prices need to move significantly higher before the economy craters.  The pace of the rise in Brent suggests further increases are likely. Pencil in another $10-20 / barrel in the next, say, 90 days.  This would put Brent in the $100-$110 per barrel around year-end.

Unsurprisingly, the Urals discount -- the difference between the Urals and Brent oil prices -- compressed last week to just under $14 / barrel, almost the smallest since the start of the war and consistent with the tendency of the spread to contract when Brent is strong.   The ESPO discount -- the difference between Russia's Pacific oil price and Brent -- similarly continues to compress, much as we have been forecasting.  ESPO is holding around $90 / barrel.  

The Urals oil price is near an eight year high and $17 higher than its level year ago, before the implementation of the Price Cap.  If we allow Brent at $100 - $110 at year end, that would peg Urals in the $86-$98 range heading into 2024.

Oil and the War

Russia is looking at a massive increase in defense spending.  The Moscow Times reports that Russia's Finance Ministry projects defense spending “to jump by over 68% year-on-year to almost 10.8 trillion rubles ($111.15 billion), totaling around 6% of GDP — more than spending allocated for social policy."  The Kremlin has limited resources to fund this increase.  Tax increases, spending cuts and international borrowing look dicey.  Therefore, Moscow is left with the alternatives of bluffing, printing money, or increasing oil revenues.  The Russian central bank does not typically bluff.  Therefore, Moscow is counting on increasing oil revenues to bankroll the war in Ukraine.  

This comes as no surprise for those who follow my macro oil forecasts and is the direct result of a poorly designed and failing Price Cap.  For example, in February, I noted in The Oil Supply Outlook (and why it matters for Ukraine) that

The conditions are present for a material tightening of the market in the medium to long term.  After 2023, oil price trends favor Russia, and perhaps substantially so.  For Ukraine, this could pose a serious threat, as the current European and US sanctions on Russian oil are unsuitable to deal with such an eventuality.

This is belatedly beginning to dawn on the Biden administration.  Even two weeks ago, various Biden administration proxies were defending the Price Cap in its current form (Benjamin Harris here and Eric Van Nostrand here).  This past week, however, the tone has turned more somber.  Bloomberg notes that "Treasury Secretary Janet Yellen said that recent market prices for Russian oil suggest that the Group of Seven’s price cap is no longer working as hoped, her first such public acknowledgment of challenges with the program."  Some analysts go farther.  Julian Lee, Bloomberg's oil markets analyst, in a Washington Post op-ed, It’s Time to Scrap the Russian Oil Price Cap, writes

It gives me no pleasure to say this, but it’s time to scrap the Russian oil price cap.

​Lee is a solid, level-headed analyst.  But in this case, his advice would be disastrous.  I would not be surprised to see Brent hovering around $110 /  barrel much of next year.  If we allow that every $25  barrel above $55 on a Urals basis allows Russia to double its military spending, then $110 Urals would allow Russia to triple its military budget compared to the pre-war era.  This is not only inadvisable, it's absolute insanity.  

The reality, unfortunately, is that the Biden administration has not a clue how to fix the Price Cap.  None of the administration, Treasury or Fed has the appropriate skill mix, which requires oil markets experience (supply and demand forecasting); oil price forecasting; an understanding of the linkage of oil prices to the economy, politics and society; crude and refined products shipping and pipelines expertise; a solid understanding of black market theory (my unique specialty); and familiarity with the eastern Europe mindset and culture.   None of this appears on, for example, the above-mentioned Benjamin Harris's otherwise impressive CV.

The rather unpleasant implication is that Julian Lee's vision, whether de facto or de jure, is likely to be realized: the Price Cap will be scrapped.  My Ukrainian readers should contemplate whether this is a desirable outcome, or whether Kyiv might finally wish to take a stand on the matter.

Ukraine's Emerging Funding Challenges

This is even more acute as Ukraine is running up against funding resistance.  This comes as no surprise once again, and for more than a year I have been warning about using the US Federal budget as a bottomless piggy bank.  To the average American, Ukraine is every bit as exotic and remote as Papua New Guinea, Yemen or Andorra.  Why are we spending so much money on that distant place?  Is it really our fight?  Many, many Americans are asking these questions.

The situation will deteriorate from here.  Part of it is simple war fatigue from the funders' side.  More importantly, we appear to be heading toward another oil shock, with JP Morgan forecasting a 7 mbpd shortfall in the oil supply by 2030, which is enormous. As oil prices break through $100, $110, or $120, the Russians will feel emboldened and Ukraine's western allies will find themselves enfeebled politically and economically, and they will progressively reduce their exposure to Ukraine. Recent Congressional theatrics and the Slovakian elections can probably be finessed.  But they are a clear warning shot and a harbinger of things to come.

The bottom line is this: The Price Cap can and should be appropriately restructured.  This would transform the war into a profit center for the US, with about $10 bn in US government annual support to Ukraine offset by about $25 bn in revenues to our defense industry.  That would silence Ukraine's critics and ensure Kyiv has plenty of money for both the conflict and reconstruction.

Rigs and Spreads Sept. 29: More of the same

  • More of the same.  Rigs and spreads continue to fall, high oil prices notwithstanding.

  • Rig counts

    • Total oil rig counts: -5 to 502

    • Horizontal oil rig counts: -4 to 447

    • The Permian horizontal oil rig count: -4, again

    • The Canadian horizontal oil rig count remains essentially unchanged over the last four months, this week down 23 from last year

  • The US horizontal oil rig count is falling at a pace of -4.0 / week on a 4 wma basis.

    • This number has been negative for 43 of the last 44 weeks

  • Frac spreads fell, -4 to 255  

    • This is still too high for the current rig count, as DUCs continue to fall.  

    • To hold DUCs steady, the spread count must fall by 20

    • It looks like the industry has settled on 16 weeks of DUC inventory, where it stood on Friday, as the new normal.

    • As a result, expect spreads to roll off pro rata with rigs from here on out -- beyond the 20-spread readjustment necessary to hold DUCs steady -- at a ratio of one spread for every two rigs.

  • The Brent Spread – the difference between WTI and Brent – is also signaling the end of the shale revolution

    • Historically, WTI sold at a premium to Brent

    • Since the shale revolution, WTI has typically sold at a discount to Brent, generally in the range of $4 / barrel in recent times.  

      • This discount was necessary to place incremental US shale oil barrels in the market.

    • In the last two weeks, the Brent spread has collapsed to around $1.50 / barrel, suggesting a tightening US market, which could be explained by low or no growth in US shale oil production.

  • Once again, nothing cheery in the data

Rigs and Spreads Sept. 22: Peak Shale?

  • This week’s numbers were all but disastrous.  Both rig counts and shale oil output continue to fall

  • Rig counts

    • Total oil rig counts:-8 to 507

    • Horizontal oil rig counts: -8 to 451

    • The Permian horizontal oil rig count: -4

    • The Canadian horizontal oil rig count continues to lag, down 28 from last year.  

  • The US horizontal oil rig count is falling at a pace of -3.0 / week on a 4 wma basis.

    • This number has been negative for 42 of the last 43 weeks

  • Frac spreads fell, -5 to 259  This is still too high for the current rig count, as DUCs continue to fall.

    • DUC inventory has fallen back to 15.7 weeks of turnover

  • The EIA’s latest DPR, published this past week, also shows shale oil output from the key plays declining, down 17 kbpd from July.  In addition, the EIA is forecasting further declines, with October shale oil output down 82 kbpd from the July peak.  That is, given the continued decline in rig counts, the EIA appears to be calling peak shale oil production for July 2023.  

    • It is important to note that the EIA routinely revises previous output figures and that EIA projections should be considered provisional, not definitive. Nevertheless, the EIA production decline forecast is consistent with the chronic erosion of rig counts we have seen since last December.  

  • Last week, I wrote this:

Lagged oil prices for the next eight weeks are consistently above $80 WTI, and at times well into the mid-$80s. As a result, we should in theory see at least modest life in the horizontal oil rig count. If we do not, it will be further evidence that the underlying problem is a lack of drilling opportunities, not unfavorable economics

    • Instead of modest rig additions, we see a stiff decline of 8 horizontal oil rigs this week, half of them from the Permian.

    • The continued decline of rig counts, particularly with lagged WTI above $80, is bad.  The decline in shale oil output from key plays is bad. And the continued erosion in the DUC inventory is also bad.  

    • There is nothing redeeming in the data this week.  Perhaps the numbers turn around at some point, but right now, the picture is ugly.

Rigs and Spreads Sept. 22.pdf

Urals heads toward $80

WTI and Brent have been rocketing up, respectively at $93 and $96 at writing.  (For those interested in the oil market dynamics, see my presentation from Italy last month.  I'll have a separate post on this).  

Urals continues to track Brent, with Urals at writing posted at $78.12.  Given the surge in Brent, we might expect to see Urals at $80 / barrel in the next week or so, $20 higher than the $60 Price Cap.  

The Urals discount is largely holding steady, about $17 at writing.  I expect the discount to narrow over time.  The ESPO discount continues to shrink, again per expectations.

Urals is now $22 / barrel above the average for the 2015-2021 period and near a peak for the week in the last nine years.  With ESPO at $89, Russia's blended crude oil export price is just about $80, sufficient to double Russia's military budget compared to the pre-war period (assuming Russia can repatriate those earnings).

The ruble continues to hold up, near 97 rubles / USD.  There has been no collapse.  Russia's central bank is doing its share, raising benchmark interest rates to 13%.  I would note that there is no such thing as 13% interest rates in the 5-7% inflation environment Russia's central bank projects for 2023.  Inflation is likely substantially higher, as I have argued, because the Kremlin is funding the war in part by printing money.  With the increase in oil prices, this pressure may ease, and it is not inconceivable that the ruble will stabilize near its current range.  Much depends on the evolving nature of Russian federal outlays, including for the war, as well as the portion of oil export earnings Moscow is able to repatriate.   

​The Biden administration's proxy at Brookings has defended the Oil Price Cap.  The author, Benjamin Harris, was one of the program's architects.  I am not certain his analysis is intended as a defense of the Price Cap; perhaps it is better read as a eulogy.  Defending the Cap is exactly the wrong response, because surging Brent and WTI will make a mockery of the supporting arguments.  Americans are not going to care a whit about rationalizations.  They are going to care about pump prices, with Republican candidates pillorying the Biden administration for its incompetence in constructing the program, and justifiably so.  The Price Cap needs to be fixed, not defended in its current form.

Rigs and Spreads Sept. 15: Stabilization

  • Horizontal oil rigs stabilized this week

  • Rig counts

    • Total oil rig counts were +2 to 515

    • Horizontal oil rig counts were +0 to 459

    • The Permian horizontal oil rig count was up 1

    • The Canadian horizontal oil rig count continues to lag, down 24 from last year.  

  • The US horizontal oil rig count is falling at a pace of  -2.0 / week on a 4 wma basis.

    • This number has been negative for 41 of the last 42 weeks

  • Frac spreads rose, +12 to 264.  Again, this is not sustainable without rigs additions.

  • DUC inventory fell back to 16.4 weeks

  • We are approaching the moment of truth for the shale industry

    • For the last several months, the breakeven to add rigs has averaged around $77 WTI

    • At writing, WTI was $91

    • Lagged oil prices for the next eight weeks are consistently above $80 WTI, and at times well into the mid-$80s

    • As a result, we should in theory see at least modest life in the horizontal oil rig count

    • If we do not, it will be further evidence that the underlying problem is a lack of drilling opportunities, not unfavorable economics

The Price Cap is keeping oil prices high

I have written several times that the adverse effects of prohibitions and related enforcement are as much as 20 times worse than the problem itself.  Today, we'll examine one of those adverse effects, the impact of the Price Cap on oil prices.

The bottom line for my busy readers is this: The Urals and ESPO discounts have motivated non-OECD buyers, notably the Chinese and Indians, to hoard as much Russian oil as possible.  As a result, excess inventories -- those above routine daily needs -- are about 1 billion barrels in the non-OECD.  As long as a discount remains, Asian buyers will continue to hoard cheap Russian oil.  If the discount disappears, that oil will return to the market, likely capping Brent around $85 through 2024, and potentially driving it down as low as $65 / barrel at times.

One might be tempted to conclude that the Price Cap should be abandoned.  This is the wrong read.  The Price Cap needs to be restructured to fix the hoarding problem, while at the same time ensuring funds for Ukraine's war effort and reconstruction. 

*****

Excess crude oil and refined product inventories are those above the quantity needed by the industry to ensure uninterrupted, regular business.  The OECD countries ordinarily carry about 60 days of crude and refined product inventory as a share of consumption.  For example, US oil consumption is about 20 mbpd (million barrels per day), and normal inventory is about 60 days of consumption, or 1.2 billion barrels.  If we had 66 days of inventory, then we could say that 6 days, or 120 mb (million barrels) of that inventory is excess.  If refiners and distributors are holding excess inventory, they will be motivated to liquidate such excess, typically by lowering prices -- the same as any other industry.

In the OECD, we know both the actual level of inventories and the volume to be expected based on normal turnover of 60 days.  Excess inventory (or the deficit of inventory) is the difference between the reported inventories and the expected level assuming 60 days.  Therefore, if the EIA reports 1.3 billion barrels of US inventory and we would anticipate 1.2 billion barrels based on 60 days of turnover, then we can say that the US has 100 mb of excess crude and product inventories.

The matter in the non-OECD is not quite as straight-forward, as non-OECD countries often report their inventory levels late, unreliably, or not at all.  Therefore, we have to impute non-OECD inventory levels.  During 2018-2019, oil markets were largely in balance and inventories were at historical averages in the OECD.  We can assume that inventories were similarly balanced during this stretch in the non-OECD and use this as a baseline for subsequent changes.  We can then adjust for subsequent builds or draws using EIA supply and demand data, deducting reported OECD inventories.  The result can be seen on the graph below.

As the graph above shows, excess inventories soared with the start of the pandemic.  Readers will recall that the world closed down and oil started piling up around the globe, with fears that available storage capacity would be swamped.  As it turned out, oil companies rapidly began to reduce their production, but excess inventories still crested over 2 billion barrels in the spring of 2020.  Thereafter, excess inventories were slowly worked off as operators withheld production and the global economy gradually recovered.  By late 2021, excess OECD inventories had all but disappeared and excess non-OECD inventories were gradually declining.  Had the war not occurred, excess non-OECD inventories would likely have dissipated by now.

However, with the start of the war, a huge discount opened up between Brent and the various Russian oil prices, incentivizing countries like India and China to load up on Russian oil.  As a result, excess inventories started to balloon again, visible in the darker red color on the graph above.  This was not the result of a mismatch between supply and demand fundamentals, but rather due to hoarding by purchasers of Russian crude.  As long as the discount persists, purchasers of Russian crude will have an incentive to load up as much inventory as they can handle.  In other words, the Price Cap is preventing excess inventories from returning to the market on a net basis.  Previously purchased cheap Russian crude is processed to make gasoline and diesel, but inventories are immediately replenished with new, discounted Russian crude.  The result is about 1 billion barrels of excess crude and refined products stored in non-OECD countries.

If the Urals and ESPO discount disappeared, holders of cheap Russian crude would have an incentive to run their inventories back to normal levels.  That is, about 1 billion barrels of excess inventory would find its way back to the market over a period of 2-3 years.  This implies a draw of 1-1.5 mbpd of crude and products from inventory, which is a lot.  This would depress oil prices.  

Moreover, excess inventories exert strict discipline on the market.  Such inventories will be stored, ready for use, in tanks conveniently located near ports and rail terminals.  They can be dumped quickly on markets in almost unlimited quantities if the price is right.  Therefore, as long as such inventories last, they would cap oil prices, likely limiting Brent to around $85 / barrel through 2024, with the potential to push it all the way down to $65 at times.  

Today, oil demand is running well ahead of supply, pushing oil prices up and putting sufficient pressure on the Biden administration to prompt the U.S. Department of Energy, as Reuters notes, to approach oil producers and refiners to ensure stable fuel supplies at a time of rising gasoline prices.  Notwithstanding, the non-OECD has an absolute ocean of excess inventory, available if the Urals and ESPO discounts dissipate, or more precisely, are properly restructured.

As I have noted before, we need to reform the Price Cap to bring it into conformity with both theory and historically successful practice.  One benefit will be lower pump prices to US and European consumers.

Urals breaks through $75

Ten days ago, I suggested we might see Urals at $75 in short order, and here it is today, $75.59 at writing.  ESPO, Russia's eastern oil export price, is trading above $85, with WTI at $88 and Brent at $92.  

The Urals discount, the difference between Urals and Brent, has once again shrunk, to $16.40 / barrel, about $2 / barrel less than ten days ago.  

The Urals price is now above its level from a year ago and near the high for the 2015-2021 period.  

It is hard to avoid the impression that the Saudis and Russians, among others in OPEC+, are working to jack prices up, in part an attempt to undermine the Biden administration heading towards the election.  The Price Cap itself is largely to blame for the situation.   As I have noted earlier, the side effects of prohibitions and related enforcement are up to 20 times worse than the underlying problem.  A cartel antagonistic to the sponsors of the Cap is but one adverse effect of a prohibition-based approach.

Rigs and Spreads Sept. 8: Continued Unwind

  • Horizontal oil rigs rolled off again this week

  • Rig counts

    • Total oil rig counts were +1 to 513

    • Horizontal oil rig counts were -4 to 459

    • The Permian horizontal oil rig count was down 2.

    • The Canadian horizontal oil rig count continues to look frail, down 23 from last year.  

  • The US horizontal oil rig count is falling at a pace of  -2.75 / week on a 4 wma basis.

    • This number has been negative for 40 of the last 41 weeks

  • Frac spreads rose, +8 to 252.  Not sustainable without rigs additions.

  • DUC inventory fell back to 17.3 weeks

  • Overall, we continue to see more of the same:

    • Roll-offs of horizontal oil rigs not justified by oil prices; frac spread counts at unsustainable levels; and a continued unwind in the Permian

US Concedes Price Cap Defeat

Despite Brent near $91 and Urals above $74 -- $14+ / barrel above the Price Cap limit -- Reuters reports that 

The G7 and allies have shelved regular reviews of the Russian oil price cap scheme...even though most Russian crude is trading above the limit because of a rally in global crude prices.

Initially, EU countries agreed to review the price cap every two months and to adjust it if necessary while the G7 would review "as appropriate" including "implementation and adherence."  The G7 has not reviewed the cap since March, however, and four people familiar with G7 policies said the group had no immediate plans to look into adjusting the scheme.

The sources said that while some EU countries were keen for a review they said that there was little appetite from the United States and G7 members to make changes.

To recap: Despite the fact that Urals has exceeded the Price Cap for nearly two months, the G7 has no plans to either review or adjust the scheme. To put it another way, the G7, and in particular the Biden administration, is substantively conceding the defeat of the Price Cap.

And why is that?  Reuters explains, from July 27th

The [Biden] administration...is set to move slowly, wary of creating ripples in a market that could send rising global oil prices higher.  The administration is in a "policy pickle" because it does not want to come down too hard with enforcement threats and risk boosting global petroleum prices by interfering with the movement of oil, the source with knowledge of administration thinking said.  "They'll spook the service providers facilitating exports, they certainly don't want to do that."  High consumer energy prices are a political risk for President Joe Biden, who is seeking reelection in 2024.

The failure of the Price Cap is not unexpected.  Indeed, I have criticized the Price Cap and the EU embargo as the wrong policy from the start -- more than a year ago now.  Prohibitions, including embargoes and price caps, virtually never work and almost always have severe side effects, by my research, up to 20 times worse than the problem itself.  This was fully evident by July 28th, when I noted that "the Price Cap can now formally be considered a failure."

Policy responses, I argued, would prove misguided, which again, a review of the historical record of prohibitions clearly indicates.  In my August 4th analysis, The Price Cap is Dead, I wrote

[Don't] expect the Biden administration, the US Treasury or the Federal Reserve to make the necessary adjustments.  When faced with a violation of prohibitions, governments' responses historically have been misguided and counterproductive.  

I elaborated on August 29th

The Biden administration is more likely to paper over the failings of the current regime or admit defeat than to make necessary and constructive modifications to the Price Cap.

This largely brings us up to date.  Eric Van Nostrand, acting Assistant Secretary for Economic Policy, continues to gamely defend the Price Cap.  The matter is rapidly descending into farce, however, and the Biden administration had better come up with something more convincing, and soon.  A likely scenario heading into the election is both sky-high oil prices -- Goldman Sachs is forecasting $107 Brent for 2024 if Russia and Saudi Arabia hold their nerve (a fair bet) -- and a blow out of the Urals price.  Given that the G7 seems in no mood to enforce the Price Cap, we can expect the Urals discount to shrink, and a worse case scenario could put Urals as high as $100 / barrel for 2024.  This is almost twice Russia's average crude oil export price for the 2015-2021 period and sufficient to triple Russia's military budget compared to the pre-war period.  This will also add drag to the western economies and depress public support for Ukraine as unaffordable.  Both the Biden administration and Kyiv will find themselves cornered.

So what are the Ukrainians doing?  The Ukrainian embassy in Washington reads all my reports.  The ambassador has had these analyses on her desk for seventeen months.  And what have they done with it?  Absolutely nothing.   No qualification, no presentation, no advocacy.  Absolutely nothing.  I am as pro-Ukrainian as they come, but it would be helpful if the Ukrainians could take just a little, baby step towards defending their own financial interests.  The difference between the abandonment of the Price Cap and restructuring it to capture the value of the Urals discount (and then some) is absolutely huge, as much as $100 bn / year if Goldman's oil price forecast holds up.  If the Cap is abandoned, those sums will go to Russia and will be used to grind down Ukraine for years to come.  Alternatively, those funds can be redirected to Ukraine and the western alliance partners, materially funding the war, eliminating the financial considerations to Ukraine's entry into the EU and ensuring that Poland and the Baltics are kitted with all the weapons they need.  And a few Republican Congressmen will be able to breathe easier.

The Ukrainians need to step up and fight for constructive financial policy as hard as they are fighting the Russians in the field.

Urals to $75?; more on Russian inflation

Urals, Russia’s crude oil export price to the west, rebounded this week on a surging Brent oil price. As of Monday, Brent was trading at $89 / barrel and Urals was once again peaking over the $70 threshold, $10 /barrel above the Price Cap.

The Urals discount, the difference between the Urals and Brent oil prices, has widened to more than $18 / barrel. Whether this is as a result of a lag in reporting Urals compared to Brent, or whether it reflects greater difficulty in the Russians placing their exports remains to be seen. At a guess, the Urals discount should trend back into the $15-16 range.

None of this bodes well for either Ukraine or the Price Cap. Barclays Bank sees Brent averaging $92 / barrel in Q4 and $97 / barrel in 2024. Assuming a $15 Urals discount, Urals could average $77 in Q4 and $82 in 2024. As a rule of thumb, each $10 / barrel translates into $25 bn in revenue for the Russian government. Put another way, every $25 / barrel allows the Russian government to double its defense spending compared to pre-war days. Barclays forecast puts Russia's oil price at $21-26 / barrel above its pre-war level.

Russia’s Inflation and Exchange Rate

Russia's inflation rate has been much debated.  The Russian Central Bank is predicting 6.5% inflation for the year, which is inconsistent with interest rates at 12.5%.  At the same time, Steve Hanke of Johns Hopkins has posited an inflation rate of 60%, which is a modeled number and not derived from observed price changes.  Inflation is also attributed to devaluation, which vastly overstates the case.  The Washington Post notes that "imports still [make] up to 40 percent of the average Russian consumer basket", which creates the impression of some sort of free-wheeling, Hong Kong style economy.  In fact, pre-war and pre-covid, imports constituted about 20% of Russia's GDP and are probably substantially less now.  

The average Russian mostly consumes Russian goods like meat, dairy, cheese, bread, butter, milk, toilet paper, laundry detergent, and, naturally, vodka, among others.  These are almost all produced locally, even if they carry global brands.  Imports will be found on store shelves, of course, but in most cases, the Russian consumer can substitute local products for these.  Further, Russians spend a large portion of their budgets on items like housing, transportation, and local services like plumbers or haircuts which are non-traded goods.  For the average Russian household -- which by definition is not located in Moscow or St. Petersburg -- the day-to-day impact of devaluation is probably on the order of 10-15% of Russians' routine consumption basket.  That is, a 20% devaluation translates into perhaps 2-3 percentage points of inflation.  This is not enough to move the needle.

Instead, posted increases in the money supply are consistent with observed devaluation and should be driving inflation of similar value.  This should manifest as Russians complaining  about prices and observed reductions in purchases of routine, Russian-made goods.  And it appears to.  The above-noted Washington Post articles reports that

One study published Aug. 16 by Russia’s largest market research agency, Romir, found that 19 percent of respondents had begun cutting back on purchases of basic goods such as toothpaste, washing powder and food in July, compared to 16 percent the month before.

These are mostly locally-produced goods, which implies material inflationary pressures domestically, and not only through imports.  And this is what we would expect.  

Similarly, Russia is seeing spot shortages of gasoline and diesel at filling stations in the country.   This results from both devaluation and inflation.  Wholesale fuel prices are determined by their value on global markets (in dollars), even as retail gasoline and diesel prices are set administratively and capped.  As a result, Russia, one of the world's leading producers of refined products, is seeing a local shortages as refiners find it more profitable to export fuel than sell it on the home markets.  Of course, the government is well aware of this.  The failure to raise domestic prices is an attempt to suppress underlying inflation and retain public popularity.  These initiatives almost always fail, and the government is sooner or later compelled to raise fuel prices.  

As I have written before, all this suggests the government is funding the war in part by printing money.  The fact that fuel prices have not been raised implies the Kremlin feels constrained in passing through all costs to consumers.  In other words, the Kremlin is boxed in politically, allowing ample room for the western powers to revise the Price Cap and Embargo programs.  Putin cannot afford to stop exporting oil.

Rigs and Spreads Sept. 1: An inflection point?

  • Rigs took a pause this week within the wider context of nine months of nearly continuous roll-offs.  In my last report from August 11, I noted that spreads at the time were too high at 262.  This number has plummeted to 244 in the intervening three weeks, with horizontal oil rigs easing back by just 7 over the same period.  As a result, rigs and spreads are now largely in balance, suggesting that the chronic erosion of DUC inventories may be ending.  With the breakeven to add rigs running around $76 WTI and the WTI currently holding a pricey $86, the prospects for a rebound in rig counts are improving.  We may be approaching the end of the mini-cycle begun last December.  Maybe.  We don't yet have enough data to call a trend, but it feels like we may be at an inflection point, or at least a mini-inflection point.

  • Rig counts

    • Total oil rig counts were flat at 512

    • Horizontal oil rig counts were flat at 463

    • The Permian horizontal oil rig count was down 2.

    • The Canadian horizontal oil rig count was again looking frail, down 25 from last year.  Whatever is going on in the US oil patch has now officially spread to Canada

  • The US horizontal oil rig count rose to -2.0 / week on a 4 wma basis.

    • This number has been negative for 39 of the last 40 weeks

  • Frac spreads fell, -2 to 244.  Spread numbers are back to the level of January 2022.  Not great.

  • DUC inventory came in at 17.9 weeks, the highest in more than a year

    • This recovery suggests a change of sentiment in the oil patch, that operators may decide to no longer pursue a policy of DUC inventory liquidations

    • On the other hand, this recovery has been driven by a collapse in the spread count, not as a result of a surfeit of rigs over spreads.  In any event, it feels like a change in the weather.  The coming weeks will tell us more.

  • In the August DPR (admittedly published two weeks ago), the EIA sees July crude and condensate production from key shale plays rising to 9.25 mbpd, up 6 kbpd from June

    • Permian production actually fell in July, down a marginal 1 kbpd over June, and in July was 11 kbpd lower than its March peak.  

    • The minor plays are up marginally over the period, supporting modest shale oil production growth in aggregate.  

    • The ‘peak shale’ thesis appears to be holding up.