Trump can end it all with a tweet

President Trump could end the shutdown and fix illegal immigration with a tweet like the one below.  

Tweet.png

This statement is entirely feasible.  Market-based visas would generate net $30 bn to the Treasury annually -- more than enough to build the wall every year.  And as it would provide on-demand access for Mexican migrant labor to the US market (for a hefty fee), the Mexican government would essentially be forced to cave to associated US demands, which could include partial funding for a wall.

Of course, the entire point of market-based visas is to close the border without a wall, but if conservatives want a wall, illegal immigrants are the obvious source of funds.  Indeed, we forecast that approximately 400,000 illegal immigrants will make it successfully over into the US this year, even as the New York Times just this week reported that coyotes are charging $7,000 / person to guide migrants across the border.  Do the math, and Trump could set up an admissions booth in Tijuana and generate nearly $3 bn from just those migrants who will successfully enter the US through the unsecured border this year anyway, with the difference that migrants would pay the US government instead of the cartels.

That the President is serious about tackling illegal immigration is laudable.  On the other hand, shutting down the government for a wall that neither a majority of the public or Congress wants is likely to hand the President a stinging defeat.  He's working on the right topic, but with the wrong approach.  

With the right approach -- market-based visas -- the President could chalk up a much-needed win by ending the shutdown and focusing on a policy most Americans will support.  A Trump tweet is a good place to start.

November Apprehensions: High, at Expectations

Border Patrol detained 51,586 persons trying to cross the border illegally in November.  This is up 3.7% (+1,855) over October, but in line with our recent forecast and on track for 600,000 border apprehensions in 2019.  November border crossings were the highest since 2006, that is, before the Great Recession.  On the one hand, this can be interpreted as a failure of immigration policy; on the other, it signals that the Great Recession (the China Depression) is over, even if it took a decade.  This in turn implies that politics are likely to move back to center, just as the November election results suggest.

Nov. Apprehensions.png

Inadmissibles, those trying to cross at official checkpoints without papers, were up a bit but nothing too exciting.


Nov. Inadd.png

Italy: Oil, the Euro and Populism

Oil influences the economy, and the state of the economy influences the balance of ideologies, which in turn establishes the boundaries of the politically possible.  Italy in particular is in the news lately, with worries about its rising populism and a potential exit from the Euro.  Much of the analysis is frankly wrong in our opinion.  Given our traditional expertise in oil and years’ experience in Central Europe, we thought to weigh in.

Some of the most misleading oil markets analysis tends to come from Bloomberg, this time in an op-ed by Nathaniel Bullard, who writes, "demand for oil consumed for transportation is already waning in certain markets and segments...there’s Italy, where demand for gasoline has fallen by nearly half since 2005."

Bullard seems to think collapsing oil consumption is a virtue.  It is not.

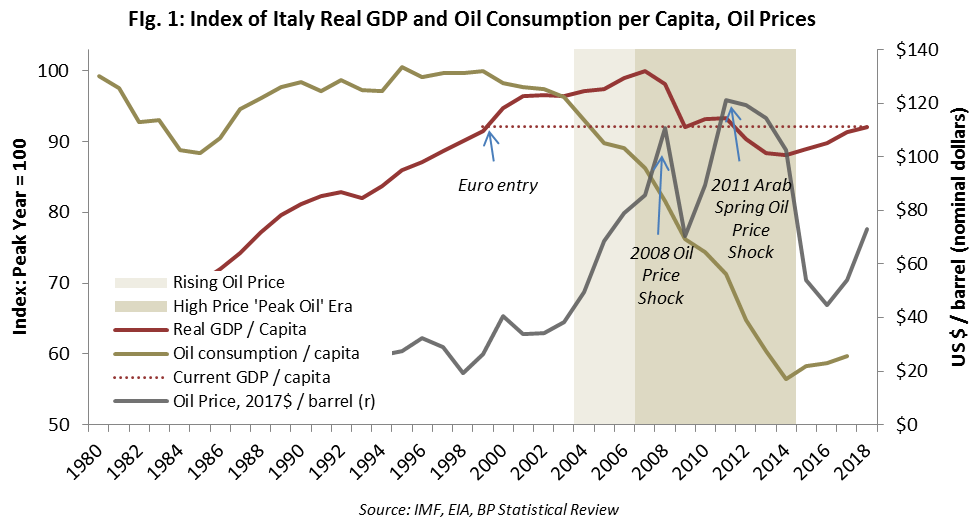
It is true that oil consumption per capita in Italy has fallen by 40% since Italy entered the Euro Zone in 1999.  But how was this achieved?

As the graph below shows, Italy’s oil consumption was relatively steady from 1980 until about 2004.  In 2004, however, the global oil supply stalled and oil prices started a swift rise from around $38 / barrel (in 2017 dollars) to $80 / barrel by 2007.  Italian oil demand began to crumble.  Then, in 2008, oil prices spiked to historical highs, contributing to the greatest downturn since the Great Depression of the 1930s.  Italy’s GDP fell by 8%.  Oil consumption plunged.

Italy and Oil.png

With the country in recession through early 2009, Italy’s oil demand continued to drop, even as oil prices fell. 

When the Great Recession officially ended in mid-2009, oil prices remained low and the global economy rallied. Italy caught its breath as GDP recovered a bit and oil consumption stabilized.

Underlying oil supply-demand fundamentals were essentially unchanged, however, and the return of global growth brought rising oil and commodity prices.  This ultimately precipitated the 2011 Arab Spring and oil supply outages in various OPEC countries.  Oil prices rebounded to historical highs on a sustained basis.  Europe was again plunged into a recession, one which would last until Q1 2013 by official cycle dating.  Italy’s oil consumption resumed its dive and GDP fell another 6 percentage points, bottoming in 2014 at 12 percent below its 2007 high.  So, yes, Italy was able to reduce per capita oil consumption by 40%, at the cost of 12% of per capita GDP.  If that’s success, well, call Italy a success.

Italy’s plight, of course, was not unique.  Greece was worse.  In fact, the entire OECD took it on the nose.

As the graph below shows, OECD oil consumption fell steadily from 2005 until 2014.  During the initial phase from 2005 to the 2008 oil price shock, oil consumption fell by 4% or 2 mbpd (million barrels per day).  But the real damage came the next year, in 2009, when the developed world was in deep recession and OECD oil consumption fell another 4 percent – an additional 2 mbpd – in a single year.

With lower oil prices in late 2009 and 2010, advanced country demand recovered briefly, only to be hammered again by the Arab Spring, which by 2014 had knocked another 0.6 mbpd off of OECD oil consumption. 

Cume Chnage in Oil Supply.png

How was this achieved?  In every case, by high oil prices.  There was no peak demand, just unrelenting price pressure, and the OECD economies were either in recession or suffering stagnation the whole time.

Now, where did all that OECD oil go? Only in 2009 did the oil supply dip briefly, and that was due to OPEC cuts in the face a collapsed oil prices. Otherwise, the oil supply saw no decline, and mostly growth, between 2005 and 2018.  So where then did the ceded OECD oil consumption go?  Of course, it’s obvious: to the non-OECD countries, principally to China.

Indeed, the entire 2005 to 2014 period can be characterized as a reallocation of global oil consumption from the developed economies to the emerging markets, with high prices stripping the advanced economies of their energy supply.  During this time, OECD consumers provided a material share of China’s and other emerging economies’ increased oil consumption.  Indeed, as the graph below shows, OECD consumers provided 80% of non-OECD oil consumption growth from 2005 to 2009.  That is, 4 of every 5 incremental barrels consumed by, say, China did not originate in increased oil production, but by bidding away the oil consumption of the mature economies.  Given the importance of oil, particularly as a monopoly fuel for transportation, the loss of oil consumption precipitated a major advanced economy recession.  Notably, all the countries which experienced a financial crisis were net contributors of oil from consumers; none of the net recipients of oil suffered a financial crisis.

This reallocation lasted a long time.  To the extent the stress has abated, the cause is clear: US shale oil production growth.  The pressure for OECD consumers to cede consumption was mitigated by shale production growth rising to such a level that both the OECD and non-OECD economies had enough oil to go around.  Indeed, US shales by themselves will represent, through 2019, 65% of global supply growth since 2005.  Shales are not the icing on the cake, they are the cake.  OPEC, Russia, Brazil and Canada are the icing.  OPEC in particular will have added a meager 2.9 mbpd in the 2005-2019 stretch—an annual contribution of 0.2 percentage points of growth—and of this, about half was added only due to low oil price pressures resulting from US shale production growth.

Surging US oil production catalyzed an oil consumption and economic recovery for Italy (Figure 1) and for the OECD (Figure 2).  After falling by 4.6 mbpd from 2005 to 2014, the US Energy Information Administration (EIA) sees OECD oil demand recovering from its trough by 2 mbpd through 2019.  OECD oil consumption had little to do with ‘peak demand’, and everything to do with the oil price.  Ample oil supplies allow Italy and the rest of the OECD to grow.

OECD Oil Consumption.png

With this background, we can turn back to the particulars of Italy.  Having entered the Euro Zone in 1999 (although tied to the ERM earlier), Italy was not in a position to devalue its currency when the recession hit.  Instead, the Euro remained – and remains – a composite of the relative strengths of the Euro Zone countries, favorable to well-governed nations like Germany or the Netherlands, but brutal to the weak southern tier countries like Italy, Spain, and in particular, Greece.   As a result, Italy could not solve its problems the historically convenient way, by devaluing the lira.  Instead, it has had to cram down imports and attempt internal deflation.

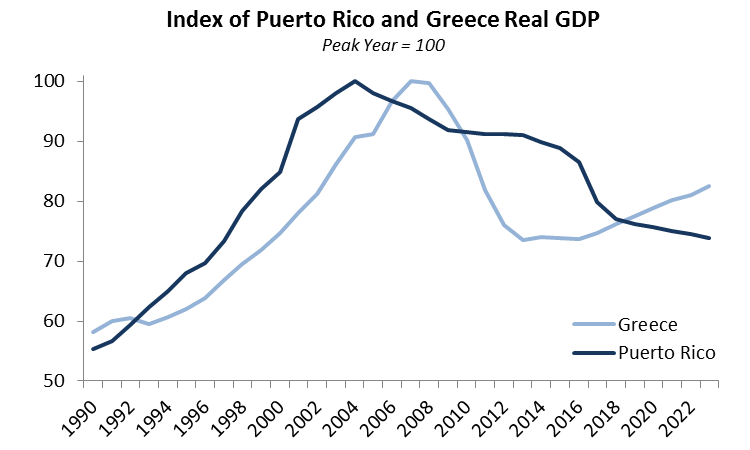
The result: Italy’s GDP / capita today remains 8% below its 2007 high.  Indeed, following IMF forecasts, the country’s GDP may not return to 2007 levels until the late 2020s – twenty years of stagnation.  There is nothing unique about this.  For example, the IMF forecasts that Puerto Rico, which is in a currency union with the United States, will see its 2024 GDP at 25% below the 2004 level.  The Great Recession was most assuredly not a recession, but a depression.  In many parts of the world, it persists as a practical matter to this day, as it does in Italy.

What then should Italy do?  In southern tier European countries, the public distrusts their politicians, their government and their entire governance structure.  For them, the Euro means Europe, the visible symbol that they are civilized people like Germans or Danes.  Leaving the Euro would mark the Italians as a lesser people, behind not only the Germans and Dutch, but also the Spanish, the Slovaks and even countries like Romania and Bulgaria, which are signed up as eventual Euro members in the ERM II program.  Euro membership is therefore first and foremost a matter of national pride and self-respect in Italy in a way it is not for, say, Switzerland, Norway or Great Britain.  The Euro is a proxy for European governance.

The cost of such fealty, however, is an economy whose glory days are behind it.  For this, the Italian public blames Brussels and Rome.  For them, European math doesn’t work, as Italy’s GDP / capita is no higher today than when the country entered the Euro Zone almost twenty years ago.

If the traditional left and right are impotent, if Euro membership has brought only economic hardship, where should the public turn?  Clearly, they are turning to unconventional solutions, to populists for example.  These politicians promise that Italy can both retain the Euro and grow a heavily indebted economy with even more debt.   The populists promise that they can defy the laws of arithmetic, and because conventional math has failed, Italians will give it a try.

If US shales can continue to grow production at their current pace for the next four years or so, then populism will likely fade and Italy will find some footing, even within the Euro Zone.

On the other hand, if US shale production under-performs, Italy may well fall into the oscillating extreme left and right populism which alt-right provocateur Steve Bannon sees as the wave of the future.  A lack of oil for growth will provide ample room for populists to offer inherently contradictory, but superficially appealing, policies.  Leaving the Euro Zone would be a better option in such an event.

In a recent debate with Bannon, conservative intellectual David Frum rejected Bannon’s populist apocalypse and stepped up to defend western liberalism.  “It is absolutely clear that liberal democracy is in trouble now,” Frum said, “[but] the failures of a good system are not a reason to turn to an evil one.  We have to review and repair.” 

What should we review and repair, exactly?  Is democracy the problem, or a lack of cheap oil?

Frum should have said, “Let’s hope US shales can supply as much oil as the world needs, for western liberalism hangs in the balance.”  That would be closer to the truth.


October Illegal Immigration: Soaring (but not Nielsen's fault)

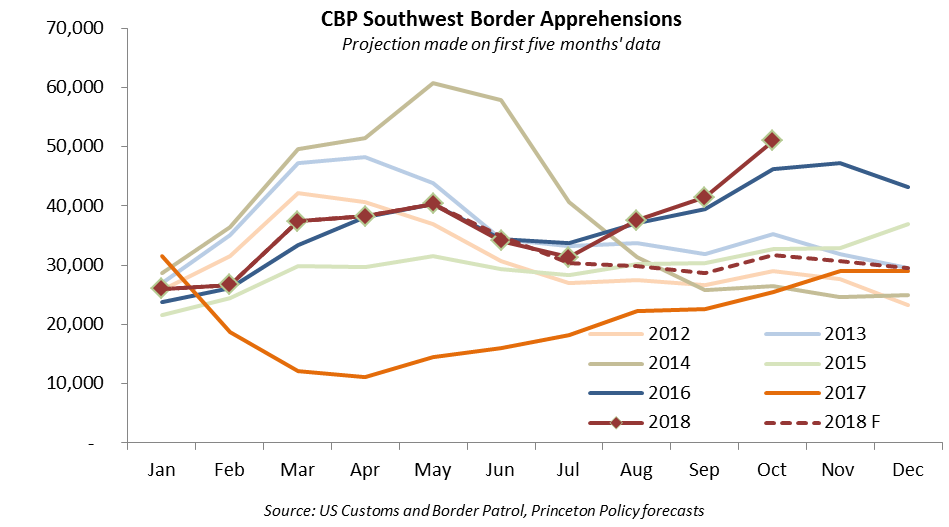
Apprehensions at the US southwest border for October came in at 50,975, up 23% over the previous month and a whopping 19,400 (+38%) over our mid-year projection.


We had stated in our earlier reports that illegal immigration could go a lot higher, to 45,000-65,000 per month, and at 51,000, the October data falls right into that range.  October apprehensions reached the highest level since 2007, which is significant because it suggests a return to pre-recession levels, which were much, much higher than recent numbers.

Oct Appre (May forecast).png

Our November forecast for southwest border apprehensions for full year 2018 now stands at 465,000, an 85% gain over the 251,000 booked in 2017.  In October 2017, we forecast apprehensions to double in 2018, and we were not far off.  

Our initial forecast for 2019 sees border apprehensions rising another 30% to just over 600,000 next year.  

Oct Appre (Nov forecast).png

Our forecasts and actuals on an annual basis can be seen on the graph below.  Next year is likely to see the highest level of apprehensions at the southwest border in a decade.

Annual Apre (Nov 2018 forecast).png

Turning to inadmissibles, those trying to cross at official entry points without proper documentation, October numbers came in near historical averages and at expectations.

Oct inad.png

While one can understand President Trump's dissatisfaction with illegal immigration numbers, firing Secretary Nielsen without a swift and credible replacement would expose DHS as a rudderless institution just as a migrant onslaught is hitting the country.  It would not reflect well on the President. 

Definitions of Ideologies

On several occasions in the media recently, ideological terms have been used incorrectly, in our opinion.  Given that we link economics to ideology and on to public policy, we have decided to draft a quick glossary of these terms as we use them and believe they are correctly, if idiosyncratically, defined:

Populist

Populism is not an ideology.  It’s an approach to marketing an ideology. 

As an adjective, the term populist means emphasizing the benefits of policy without mentioning the costs.  It is possible to be a populist conservative, or a populist progressive, fascist or socialist.    On the right, populist rhetoric includes phrases like “tax cuts will pay for themselves”, mathematically impossible except at very high levels of taxation and worth about $500 bn of deficit this coming year.  On the left, populist rhetoric includes “free education” and “free healthcare”.  Neither of these is free, not by a long shot.

Populism, therefore, implies policies which are inherently contradictory, insupportably expensive, or detrimental to the economy and society in the long run.  The more extreme the ideology or proposed policy, the greater the need for populism.  Populism will flourish when the economy is in distress and the elites are discredited, most notably during depressions.

In the media today, populism is regularly conflated with fascism.  They are distinct, although we have been seeing the emergence of populist fascism.

Liberal and Libertarian

Prior to 1929 in the US (1917 in the UK), and to the present in economics, liberal meant pertaining to the rights and perspective of the individual, that is, to personal freedom.  Historically, egalitarians (progressives, socialists) cohabited as the junior partner of the liberals on the left (not the right).  With the rise of communism in Soviet Russia and the welfare state under FDR, the classical liberals were forced to the right to join the anti-communist coalition, but the term liberal stayed with the left, now meaning egalitarian.

The liberals were forced onto the island of ‘libertarianism’, a loathsome term for three reasons.  First, it’s awkward to pronounce.  Second, the left misappropriated the name of the true liberals and egalitarianism is most decidedly not liberal.  And third, libertarianism typically ignores public goods and externalities which are an integral part of classical liberalism, essentially as laid down by Adam Smith.  When using the term ‘liberal’, we typically mean ‘classical liberal’, but ‘classical’ will usually be added to the term for clarity.

Conservative

If liberal means pertaining to the individual, conservative means pertaining to the group and the rights and obligations of the group with respect to its members.  Liberal means player, conservative means team.  This is an idiosyncratic definition, as ‘conservative’ is usually taken to be ‘white, Christian and male’, but confusingly, can also be ‘Arab, Muslim and male’ in, say, Saudi Arabia.   We avoid this problem by framing the concept of ‘conservative’ in terms of group vs individual dynamics, rather than as relating to any specific race, religion or organization.

Conservatism deals with rules, standards and norms which apply universally throughout the group (but not outside it).  Respect, propriety and deference are all conservative values, and they apply to all members of the group, for example.

Fascist

Fascism is an extreme form of conservatism and implies that certain members of the group receive preferential or discriminatory treatment based inherent characteristics, typically race or religion.   By this standard, both affirmative action and the Holocaust fall under fascism, although of course many feel that affirmative action has positive benefits and the Holocaust was the embodiment of hatred and evil.   As we use the term, fascist does not mean Nazi or a member of a political party, but rather an ideology which deliberately discriminates against some group based upon unalterable characteristics, but without necessarily specifying the nature of the associated discriminatory policies.  Fascism is based fundamentally on the concept of distinguishing ‘us’ from ‘them’.  Whereas conservative deals with universal principles applicable to all members of a given group or society, fascism is particular in whom it favors and marginalizes.  “No shoes, no shirt, no service.”  That’s conservative.  “No Mexicans.”  That’s fascist.

Both conservatism and fascism give priority to the group over the individual and can be ‘illiberal’ as such.  For conservatives, it is about who is allowed to steer the boat, where it is taking the passengers, and norms and standards on board.  It is that for fascists, too, but fascists are throwing some of the passengers into the sea.  As such, fascism is incompatible with ordinary civil rights, and involves, if pushed to its logical conclusion, the ceding of dictatorial powers to society’s leader.  It also tends to devolve into open conflict, as those passengers slated for the waves are apt to rise up in rebellion.

All people have some fascist tendencies.  We tend to prefer to live with and be governed by people like ourselves.  This is the essence of self-determination, itself a fascist concept. 

Egalitarian

If fascists define society in terms of inside/outside, egalitarians define it as up/down.  Egalitarians want to increase the wealth and income of those below the median by taking it from those above the median.  This makes good theoretical sense in a static world of declining marginal utility, that is, a poor man benefits more by gaining a dollar than a rich man loses by ceding it.  Under such conditions, society as a whole is better off with redistribution because the gains to low income individuals are greater than the losses to high income persons.  In a dynamic world, of course, redistribution reduces the incentive to work and conform to social norms, and converts income which would have been invested into income which was consumed. 

Egalitarians come in ‘soft’ and ‘hard’ versions.  Social democrats and progressives do not see wealth or a market economy as intrinsically bad, but want to move some of the gains at the top to help the bottom.  By contrast, socialists and communists see wealth as inherently evil, and equality is as much about punishing the wealthy as helping the poor.  Like fascism, socialism and communism involve coercion, because individuals are prevented from transacting voluntarily. 

Egalitarianism has both liberal and conservative versions.  Liberal egalitarianism takes the classically liberal ‘freedom to’ and modifies it with egalitarian ‘freedom from’.  FDR’s famous Four Freedoms embodies just this extension.  These included classically liberal freedom of speech and worship, augmented with the egalitarian ‘freedom from want’, the logic of which underpinned the expansion of the welfare state in the US.

Compassionate conservatism is the conservative version of egalitarianism.  In this case, redistribution is top down from the hierarchy rather than bottom up from a proletariat revolution or taxation passed through a left-dominated legislature.  All types of egalitarianism lead to high levels of social spending, but arise from differing motivations.  One is about confiscation, the other about social obligation.   Conservative egalitarians are often referred to as RINO’s, Republicans in Name Only.

Ideologies as Fundamental to the Human Condition

There is a tendency to equate ideology with political parties or team identity, Republicans versus Democrats or liberals versus conservatives.

We treat ideologies as the game theoretic result of social groups characterized by increasing returns to scale.  If working as a team is better than working alone, then teams will exist, and they will require leadership, organization and an associated allocation of effort, risk and reward.  The group member will routinely be conflicted between ‘being a team player’ and ‘looking out for Number One’.  Duty and desire frequently clash, and there is no permanent resolution one way or the other. 

Those at the bottom half of society who struggle to keep up will sooner or later turn to suasion in the hopes of influencing leadership to allocate some of the society’s resources their way.  Whining is the strategy of the egalitarian. 

Conservatism, liberalism and egalitarianism exist because of increasing returns to scale.  The resulting politics are inherent to any group or organization.  The challenge, therefore, is not to defeat a competing ideology, but to manage a portfolio of ideologies.  It is possible to turn conservatives into fascists, and fascists into liberals.  It’s all about understanding how the levers work.

Mexico Remittances and the End of Fascism

Fascist tendencies -- xenophobia, intolerance and the desire for a strong leader -- tend to peak when the economy finds itself in a prolonged downturn.  With fewer resources and an uncertain outlook, citizens feel they can ill afford to extend themselves for outsiders.  At times like this, in the last several years as well as during the Great Depression of the 1930s, people want to close the border and expel foreigners.  

But it doesn't last.  Sooner or later, the economy recovers and the need for affordable labor overwhelms the fear of strangers.

We can see this dynamic in remittances (including both legal and illegal migrants) from the US to Mexico.  From 1990 to 2007, remittances to Mexico grew at an annualized rate of 13% and declined only once, during the 1991 recession.  The 2001 dot.com bust barely registered for migrant Mexicans, with remittances up 9% that year (and 50% the following).  

All this ended in 2007.  With the Great Recession, remittances fell, and fell hard, bottoming in mid-2013 at 25% below the 2007 peak in real terms.  Indeed, remittances only recovered their 2007 inflation-adjusted value this past summer -- eleven years later. 

Population changes parallel remittances.  Pew Research estimates that that the unauthorized Mexican population by 2016 was 19% below its 2007 peak (and probably not much recovered to the present).  If the Great Recession was bad for US citizens, it was a disaster for the undocumented Mexican community.  Indeed, as we have argued before, had the US southern border been completely unenforced during the last decade, the undocumented Mexican population would be lower than it is today.  More Mexicans would have taken advantage of the opportunity to get out, confident in their ability to return in better times.

Sources: Bank of Mexico, FRED, Pew Research, Princeton Policy analysis

Sources: Bank of Mexico, FRED, Pew Research, Princeton Policy analysis

For the purposes of migrant policy, there are a few important conclusions:  

First, as during the 1930s, a prolonged downturn will generate resentment of foreigners and hostility from the host population.  When the economy is doing poorly, immigrants are likely to take a disproportionate share of the blame.  On the other hand, when the economy recovers, the will to act harshly towards migrants dissipates as labor shortages capture the public's attention.  Hatred and conflict are exhausting and hard to maintain when objective conditions improve.  Conditions have improved, and with it, the moment has passed for those hoping for a wall or large scale deportation.  

Second, remittances are growing quickly, rising at a 10% annual pace.  This suggests that wages are again above the Relocation Wage.  This explains the surge in border apprehensions in August and September.  Coming to the US is a business proposition again.  

For President Trump, this is all bad news.  In 2019, he is likely to preside over the highest level of illegal immigration since the Great Recession even as voters -- and with them, Congress -- show an increasing indifference to entire matter.

Third, the window is closing on a market-based approach as well.  The default policy for illegal immigration in the US is, ultimately, indifference and the blind eye.  The costs and benefits are asymmetrical, with the Mexicans taking most of the cost.  The extraordinary pathology of illegal immigration across the US southwest border — second only to Venezuela as a humanitarian crisis in our hemisphere — is entirely stable and condoned.  We have lived with this invisible human tragedy for fifty years and, as a matter of policy and public taste, are willing to live with it for another fifty. Those of us who value order and decency above ideology are in hardly better shape than our more conservative colleagues who long for a wall.  The window is closing.

But the window is not closed yet.  Trump will do a deal.  If asked, he will sign a bill to put migrant labor on a market basis.  It would be his crowning achievement.  

If he's asked.

September: Blowout Month for Illegal Immigration

US southwest border apprehensions came in at 41,486 for the month of September, nearly 4,000 above the previous month and a whopping 12,750 (31%) above our forecast of just three months ago.  This was the highest September count in a decade.  


The only comparable year in recent times was 2016, and numbers were elevated then due to an acceleration of migrants crossing in anticipation of President Trump winning the election and clamping down on migrants as he took office in early 2017.  The surge we are seeing now is pure economic strength, presaged by rapidly rising remittances to Mexico reported for July and August.

Sept Appreh.png

Assuming the global economy holds together, we should anticipate that apprehensions will recover to the 45,000 - 65,000 / month level which prevailed prior to the Great Recession.  From the migrant perspective, the good times are back.

Sept Appreh Hist.png

Inadmissibles, those who try to cross at official entry points without proper documentation, remained range-bound in September.

Sept Inad.png

Experts swiftly reject 22 million illegals count

Leading US experts have flatly rejected a new estimate of 22 million illegal immigrants residing in the US.

On Friday, a team from the Yale School of Management released a report which estimated the illegal immigration population in the US at 22 million, nearly double the accepted value of 11.3 million.

Condemnation from all sides was swift.

The Pew Research Center discounted the results as "completely inconsistent with basic demographic data sources in the US and Mexico."  Pew's estimates of the illegal immigrant population constitute the gold standard in the business and are widely accepted by both pro and anti-immigration advocates.  

While we consider Pew as generally sympathetic to migrants, the Center for Immigration Studies (CIS) is not.  The CIS has historically supported restrictions on immigration.  Nevertheless, CIS Director of Research Steven Camarota  was swift to reject the Yale teams' findings as 'unsupportable'.  In a Saturday note, Camarota writes that a 22 million estimate "requires accepting that every Census Bureau survey missed huge numbers of people and that most administrative data from the federal government is woefully incomplete. There is no body of research that corroborates such a claim."

Nor did the Yale study find any help from a team at the non-partisan Migration Policy Institute.  They note: "[P]eople leave footprints that are seen in statistical records—namely in birth, death, school enrollment, housing, and other records...We believe these new numbers [from Yale] represent at most an interesting academic exercise, but are ultimately greatly off-base and thus counterproductive to the public’s very real need to understand the true scope of illegal immigration and how best to address it."

These three think tanks -- Pew, CIS and MPI -- materially comprise US expertise in illegal immigrant demographics.  That they universally and rapidly rejected the claims of the Yale team suggest that the 22 million estimate is unlikely to gain traction in policy circles.

Illegal immigration could go a lot higher

The historical track record suggests illegal immigration could rise substantially over the August level.  

The conventional wisdom holds that illegal immigration has fallen due to demographics and a more prosperous Mexico under NAFTA.  No doubt some of this is true.

Notwithstanding, US wages are still 2-3x that of Mexico and 7x that of the Northern Triangle (Honduras, El Salvador and Guatemala), even after adjusting for the higher cost of living in the US.  Moreover, in one survey, a third of Mexicans stated that they would like to work in the US, and presumably that number is even higher in the Northern Triangle states.  That is a potential work force in the tens of millions.

We have contended that illegal immigration is primarily economic and driven by labor demand in the US.  Moreover, we view the Great Recession as a depression (with all the ancillary manifestations, like rising racism and nascent fascism). 

Depressions take a long time to resolve, with seven to ten years not a bad estimate.  But sooner or later the gloom lifts, and the traditional motors of the economy re-engage.  With a strengthening recovery, illegal immigration could return to levels reminiscent of pre-Recession days, that is, to 45,000-65,000 SW border apprehensions / month, 50-100% higher than the year-to-date average.  Certainly, the Latin American workforce is available and US wage incentive is in place if the labor demand materializes.

Aug App by year.png

We have consistently argued that black markets -- including those in migrant labor -- are virtually impossible to extirpate, and that it is frankly not worth trying.  Far better to take the same approach the US did with alcohol in 1933 and marijuana this decade: legalize the activity and tax it.  The migrant's decision to work in the US and the US employer's decision to hire a migrant is ultimately a business decision.  The US government should treat it as such and focus policy on insuring that the country (and its conservatives) are compensated at market rates for allowing migrants access to our labor markets.  

For both Trump and incoming Mexican president Obrador, the legalization of migrant labor could be the defining victory of their administrations.

Here they come! Border crossings surge

Apprehensions at the US Southwest border in August surged to 37,554, up 6,241 (+20%) over July and nearly 7,700 (+26%) compared to our forecast.   This represents a material change in trend, and in fact represents the highest level of apprehensions for the month since 2010. Credit the US economy.  Readers will recall that we expected a higher level of apprehensions as illegal immigrants took advantage of job opportunities in the US.  That expectation looks to be taking hold in August, and it might reasonably be expected to persist for the balance of the year.

Aug Appre.jpg

By contrast, inadmissibles, those trying to cross at official crossing points without proper documentation, have remained at more depressed levels. After the spring's surge, inadmissibles numbers declined with the administration's 'zero tolerance' policy.  Although the policy has been rescinded, inadmissibles numbers have not recovered.  In August, inadmissibles numbered 9,016, up 4% over July and 6% over long term averages, but well off a trend line based on the first four months of the year.  In aggregate, we might considered inadmissible numbers for August largely close to normal, neither much better nor worse than longer term averages.

Aug Inadd.jpg

Policy Issues associated with Marijuana Legalization

  • Supply

    • Designated regulator(s)

    • Local growing of marijuana

    • Co-mingling of legal and illegal production

    • Purchases of supply from out of state

    • Development of pharmaceutical expertise

    • Drug product variations (smoked, vaped, ingested, etc.) and their implications for use, abuse, and drug perception

    • Approval, licensing and controls over producers and retail outlets (roll of municipalities)

    • Remote delivery policy and enforcement by post or courier

    • Reporting, monitoring and enforcement

    • Implementation roll-out

  • Consumption

    • Purchase standards

    • Expected usage trends

    • Impact of product variants on usage rates and public perception

    • Marijuana tourism and illicit exports from the state

  • Health and safety impacts

    • Risks related to driving, workplace absence

    • Potency standards, regulation and enforcement

    • Product purity standards, testing, monitoring and enforcement

    • Hospital and health facility reporting requirements and implementation

    • Addiction rates

    • Relationship to alcohol (complement or substitute)

    • Marijuana as a 'gateway' drug

    • Impact on the opioid crisis (the introduction of widespread use of fentanyl in illicit drug adulteration appears to be driven in signifcant part by an attempt from cartels to replace lost marijuana smuggling revenues; some fentanyl is making its way into the marijuana supply)


  • Fiscal Impact

    • Revenues

    • Development of legal v illegal market

    • Optimal taxation

    • Financial reporting, monitoring and enforcement

  • Public Outreach and Communication

    • Public perception of marijuana

    • Management of public awareness and concerns regarding legislation and implementation

    • Health warnings - TV, packaging, etc.

    • Prohibition / permitting of local retail outlets and marijuana cultivation

  • Impact on judicial system and sentencing

    • Impact of marijuana legalization on inner city crime rates

    • Impact on hard drug trade and related violence (Hard drug smuggling is up sharply as Mexican cartels are looking to replace lost marijuana sales.  Hard drugs from Mexico are distributed through Chicago and are the key contributor of the escalating violence there).

    • Impact on courts and prison system

  • Interstate issues

    • Potency harmonization

    • Best practices sharing

    • Coordinated enforcement

    • Data sharing

PROMESA nearly killed more Puerto Ricans than Hurricane Maria

Excess Deaths in Puerto Rico from Hurricane Maria:

Reviewing the Milken Study

Steven Kopits / steven.kopits@princetonpolicy.com

In late August, the Milken Institute of Public Health at George Washington University released its long-awaited study, Ascertaining the Estimated Excess Mortality from Hurricane María in Puerto Rico (the Milken Study).  As did the Harvard-led Mortality in Puerto Rico after Hurricane Maria (MPR) study, the Milken Institute tallied the excess deaths which could be attributed to Hurricane Maria. 

We had earlier been sharply critical of the Harvard-led MPR study as materially misleading in terms of excess deaths following the storm.  We assess the Milken Study similarly to provide an independent review of this politicized topic.

We conclude that Milken’s year-end estimate of 2,098 excess deaths is supportable given certain plausible assumptions.  Our own calculation for this period yields 1,439 excess deaths as we believe that fewer people left the island and those who left were younger than does Milken.  Further, unlike Milken, we believe deaths were rising on the island due to PROMESA austerity, and therefore our expectations of baseline deaths were higher, and excess deaths from the hurricane were thus correspondingly lower. 

Unlike Milken, we are unable to identify any excess deaths on the island in January-February of this year, and thus believe Milken’s Sept. 2017 – Feb. 2018 excess death count is twice that of a more plausible estimate.

PR1.jpg

Deaths

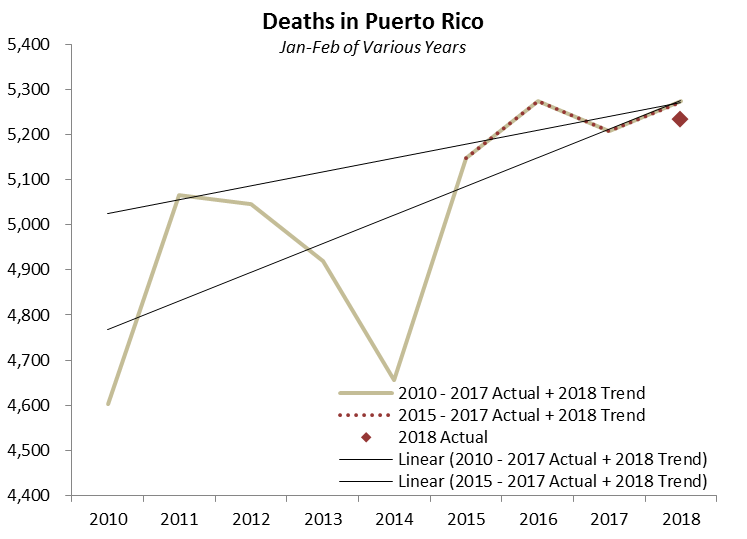
Deaths in Puerto Rico tell a curious story.  From 2010 to 2015, deaths were falling at a pace of about 175 per year.  That trend turned around, however, in 2015.  Since then, deaths have been rising at the pace of about 1300 per year.  Which trend should we use for establishing baseline expectations?

We believe the more recent trend is more compelling.  Why? Because Puerto Rico hit a fiscal wall when it defaulted on its loans in 2015.  This upended public services on the island.  Indeed, the Obama administration in October of that year urged Congress to devise a plan for Puerto Rico's massive debt in order to avoid a humanitarian crisis.  The subsequent mortality numbers give an idea of what a humanitarian crisis might look like.  For example, deaths in the first eight months of 2017 alone – before the hurricane – were 570 above the 2015 trough.

Source: Government of Puerto Rico, Milken Study, Princeton Policy analysis

Source: Government of Puerto Rico, Milken Study, Princeton Policy analysis

Thus, the numbers suggest that the excess deaths did not begin in Puerto Rico after the hurricane, but in fact two years earlier.  Cuts in spending were implemented from 2016 at the behest of the Federal government’s Fiscal Control Board, which oversees fiscal matters in Puerto Rico under bankruptcy.  To all appearances, cuts in healthcare budgets led to markedly increased mortality. 

If we thus use the post-bankruptcy 2015-2017 linear trend as the basis for our expectations and project the first eight months of 2017 onto the balance of the year, then we would have expected 29,939 deaths for the year as a whole barring Hurricane Maria.  As it was, deaths came in at 30,917,  representing 1,218 excess deaths for 2017 as a whole (after adjusting for an undershoot in the first eight months of the year).

By contrast, if we look at the Jan.-Feb. 2018 period, excess deaths are hard to find.  A linear regression based on either the 2010-2017 or the 2015-2017 actuals yields essentially the same number of expected deaths, around 5,272 for the two month period.  The observed number of deaths totaled 5,233, about 39 less than expected.  It is hard to conceive of an approach which would reach a much higher number of excess deaths for this particular period.

Source: Government of Puerto Rico, Milken

Source: Government of Puerto Rico, Milken

Thus, before counting those who left the island, we calculate the number of excess deaths for the Sept. – Dec. 2017 period at 1,218, and 1,179 for the full Sept. 2017 – Feb. 2018 period. 

Deaths adjusted for Puerto Ricans fleeing the hurricane

Milken argues that mortality needs to be adjusted for those who left the island but would have died had they remained.  This is a bit like counting those who escaped a burning building as having died from a statistical point of view, but it is not entirely without merit in attributing deaths to the hurricane.

How many people left the island due to the hurricane?  Air departures provide a good metric.

Puerto Rico lies 1,000 miles southeast of Florida.  As a practical matter, people enter and leave the island by air.  A ticket for the two-and-a-half hour flight from San Juan to Miami can be purchased for a mere $132 one way on Jet Blue (albeit the ticket was vastly more expensive in the immediate aftermath of the hurricane).  The alternative would be departure by boat, which would be highly impractical for any at-risk person, for example, one with a heart condition or requiring dialysis.  Therefore, we can anticipate that virtually all those Puerto Ricans fleeing from the hurricane did so on commercial airlines, primarily to the US.

The number of net departures from Puerto Rico is readily available from Bureau of Transportation Statistics data.  Departures have exceeded arrivals on the island for many years.  Before Puerto Rico’s financial crisis, about 45,000 people emigrated annually.  From 2014, net departures jumped to 84,000 per year.  Interestingly, net departures in 2017 before the hurricane had fallen back to levels more typical for the island. 

As Milken contends, the data does indeed show an abnormal exodus from the island.  For 2017 as a whole, 281,000 people left the island.  This trend reversed in early 2018, with about 75,000 returning through February.  

Source: Bureau of Transportation Statistics for San Juan, Aguadilla, and Ponce Airports.

Source: Bureau of Transportation Statistics for San Juan, Aguadilla, and Ponce Airports.

For our purposes, we are concerned with those who left directly as a result of the hurricane, as that relates to the counter-factual.  By early September last year, hurricanes Harvey and Irma had already pounded Houston and Florida respectively.  Those who left the Puerto Rico in early September may have done so in anticipation of a similar blow to the island.  Therefore, departures due to Maria are reasonably estimated to start from the beginning of September.

On the graph below, we can see cumulative net departures from September.  These peaked at 212,000 in December, before reversing early in 2018 and settling at 130,000 at the end of February.  Of course, the counter-factual involves an adjustment for those who would have traveled even without a storm.  To make this adjustment, we can use either the previous year or the previous decade average, which yield essentially similar numbers.  Subtracting out net departures from earlier years yields a slightly higher peak value, 218,000 net departures to December, and 136,000 at the end of February, which is coincidentally also the average for the post-hurricane period.

Source: Bureau of Transportation Statistics for San Juan, Aguadilla, and Ponce Airports.

Source: Bureau of Transportation Statistics for San Juan, Aguadilla, and Ponce Airports.

By contrast, the Milken Study estimates a population reduction by approximately 8%, or 280,000 persons from September to February, about 276,000 if adjusted for the surfeit of deaths over births during this period.

Based on the data available to us, the Milken Study looks high by a factor of two.  It is not clear how Milken’s incremental 140,000 decamped Puerto Ricans actually escaped the island.  We believe a better estimate is the 136,000 incremental Puerto Ricans who, based on air travel records, were absent from the island on average during the Sept. 2017 – Feb. 2018 period.

Demographics of those leaving Puerto Rico

Milken’s assumptions about the age groups of Puerto Ricans who left the island after Hurricane Maria are not made explicit.  The default expectation could be that PR residents left pro rata to their share in the population. 

Nevertheless, this is not the historical precedent.  Although the total population of the island declined by 446,000 in the decade to year-end 2017, the age cohort trends were quite varied.  Almost half the decline came from children under 15, and the remainder from the 15-64 age group.  The 65+ age group actually grew during the decade, up 34,000, with the senior cohort’s average age also rising.  This is no different than population trends in, for example, other remote or rural areas: Young people move out; the elderly stay. 

Source: Statista

Source: Statista

Nor did this pattern appear to change in 2017.   As part of its survey, the MPR Study asked island residents about migration patterns in the previous year.  Their answers suggest that only 5% of those who left the island last year were 65 or older.  By contrast, 15% of the island’s population falls into the 65+ age group. 

Age Distribution of Persons who left and those who remained in Households in Puerto Rico, 2017Source: Mortality in Puerto Rico after Hurricane Maria

Age Distribution of Persons who left and those who remained in Households in Puerto Rico, 2017

Source: Mortality in Puerto Rico after Hurricane Maria

If we use the 5%/95% split for 65+ and all other age cohorts, then only 7,000 of the 136,000 who left the island were 65 or older, and 129,000 were in younger age groups. 

The Milken Study reports that 77% of deaths on the island after Maria were of adults 65 years and older.

If we apply this rate to 136,000 Puerto Ricans on average who were absent from the island during the Sept.-Feb. period due to the storm, then 346 additional persons would have died had they stayed on the island through February 2018, with about half of these 65 or older. 

Using these numbers, we can begin to assemble a complete view of excess deaths on Puerto Rico and of Puerto Ricans on the island as of Sept. 1, 2017. 

PR1.jpg

Whereas Milken sees about 2,100 excess deaths during the Sept.-Dec. 2017 period, we see only 1,440, which if one used slightly different approachs could be +/- 200. For the Sept.-Feb. period as a whole, Milken sees nearly 3,000 excess deaths, whereas we estimate a much lower 1,525.   Milken’s Sept.-Dec. estimates could be plausible if one assumed long-term trends in deaths were the right measure, rather than the 2015-2017 post-bankruptcy trend which we feel is more appropriate.  Furthermore, one could generate a greater number of deaths from decamped Puerto Ricans if one assumed that a greater portion of elderly fled to the US to avoid the hurricane.

In the end, the Milken death estimates for year-end look a bit high, but not inconceivable.  On the other hand, Milken’s Jan-Feb. estimates feel quite wide of the mark, given that 75,000 islanders returned from the US at that time.  If an excess 900 people died during that two month period, it is unlikely so many would have returned, for it speaks to living conditions no better than during the immediate aftermath of the hurricane, despite the fact that 75% of the island had power on average during the January-February period.  Further, no plausible linear regression can put death counts in Milken’s ballpark for 2018.  Thus, Milken’s excess death estimates through Feb. 2018 look twice as high as a more plausible scenario.

The Bigger Picture

Whether 1400 or 2100 people died as a consequence of Hurricane Maria is, to an extent, a debate in semantics.  A large number of people died prematurely due principally to a loss of power.

The extent to which this could have been avoided is an interesting question.  We can compare the restoration of power to Puerto Rico and the Virgin Islands, the latter slammed by both Maria and Irma. 

Despite all the problems with PREPA and logistics, power was actually restored on Puerto Rico faster than on the Virgin Islands through the end of the year.  Thereafter, Puerto Rico lagged, but during the stages of elevated mortality, Puerto Rico was in no worse shape than the Virgin Islands, suggesting that logistics and geography were principally responsible for the delay in restoring power, at least through year-end. 

Source: Various press reports, Princeton Policy analysis

Source: Various press reports, Princeton Policy analysis

The hope of quickly rebuilding a power grid in the event of a hurricane is probably too optimistic.  The separate experiences of Puerto Rico and the Virgin Islands suggest that restoring power to even half the population can take four months, and about six months to complete the job.

Rather, efforts should be geared towards identifying and protecting those at risk, which the Milken Study indicates are men 65 or older most likely with serious pre-existing conditions.  Policy should be geared to evacuating this group quickly from the island, gathering them in central locations with emergency power, or keeping a store of up to 1,000 portable generators to provide home power to this cohort.  The cost of appropriate portable generators and three months of fuel, for example, comes out around $25 million – a drop in the bucket considering grid repair costs otherwise.  In any event, reliance on grid resilience for islands exposed to full force hurricanes is almost certainly misplaced.

*****

Causes of Excess Mortality

The media and research institutions have focused heavily on the impact of Hurricane Maria on Puerto Rican mortality.  This is understandable, but the data suggest Maria was just another nail in the coffin of Puerto Rico’s viability.  Our analysis suggests that, just as the Obama administration warned, cuts to public services have indeed created a humanitarian crisis in Puerto Rico.  Deaths did not start to rise with Maria.  They started to rise in 2016, the year after Puerto Rico declared bankruptcy and the Congressionally-appointed Fiscal Control Board implemented major cutbacks in the island’s social safety net.  To appearances, these cutbacks led to an increase in mortality – exactly the humanitarian crisis which was predicted.  We estimate the excess deaths from PROMESA cuts in 2016 and 2017 at 1,050 to 1,300 depending on the approach used. This is not much less than the 1440 we attribute to Hurricane Maria.

Source: Government of Puerto Rico, Milken Institute, Princeton Policy estimates

Source: Government of Puerto Rico, Milken Institute, Princeton Policy estimates

With more austerity coming, Puerto Rico’s prospects remain bleak.  This year, Puerto Rico’s cumulative economic performance since the start of the Great Recession will be worse than that of Greece.  Whereas Greece is recovering, the IMF expects Puerto Rico’s GDP to continue to fall as far as they eye can see.  By 2023, Puerto Rico’s GDP is expected to be less than three-quarters of its 2004 peak.

Source: IMF April 2018 WEO

Source: IMF April 2018 WEO

Hurricane Maria is thus but one chapter in two decades of Puerto Rican misery.  Of course, a clear accounting of mortality from the hurricane is important.  But we should not lose sight of the bigger picture, that the island is besieged from many sides, and Hurricane Maria is just a particularly bad chapter in a longer story of suffering and decline.

Puerto Rico Excess Mortality.xls

1.1 Million Cases of Migrant Victimization in 2018

Our updated analysis anticipates 1.1 million cases of predation and victimization of undocumented migrants crossing the US southwest border in 2018.

Here's the breakdown:

Princeton Policy Advisors analysis

Princeton Policy Advisors analysis

Deaths

Border Patrol typically records 300-450 deaths of illegal crossers in the desert annually.  However, when adjusted for bodies not found, bodies found by other state and local agencies, and assumed deaths on the Mexican side of the border, crossing deaths probably reach 1,000 per year.

In addition, many migrants die in the Mexican interior.  Of Mexico's 18,000 murders which can be directly attributed to US and Mexican immigration and drug policy, 10-20% are probably migrants.  Thus, an additional 1,800 - 3,600 death can be attributed to the illegal migration, bringing the aggregate total to 2,800 - 4,600 deaths.  Our best estimate puts this number around 3,000 / year, with 2,200 our 'official' estimate.  For more information, see the 'Death' tab at the linked spreadsheet.

Kidnapping and Extortion

Various third party estimates put the kidnapping and extortion of migrants in the 27,000 / year range.  The fate of those kidnapped is not entirely clear.  Many are ransomed, but what of those who are not?  They may be released, killed, or impressed to work for the cartels.  A death rate of 5% would not be particularly implausible.  In fact, given that Mexico has perhaps 40,000 unidentified remains and almost as many missing persons (some of which are surely double counted), the percentage could prove higher.  We have not made an estimate of kidnapped migrants impressed into gang service, but a number around 10,000 / year would hardly seem surprising.

Assault and Robbery

Assault numbers were below our a priori expectations, reinforcing the impression that crimes against undocumented migrants are principally economic.  By and large, criminal Mexicans do not beat up Central Americans for the fun of it.  They do it to take their money.  At shelters in central Mexico, well south of the lawless border region, 10% of those Central American migrants using the facilities reported being robbed--and that's about half way through Mexico.  By the time migrants make it through the border zone, we think it likely that 20% will have been robbed at some point along the way.

Human Trafficking

Broadly speaking, human trafficking can result from coercion, deception or as a kind of loan sharking.  Victims typically find themselves in forced labor for men, and prostitution for women.  This may result from kidnapping or deceiving an individual into an unexpected situation.  For example, women may be told that they will be taken as hotel maids, and instead be forced into prostitution and held captive there.

In addition, in some cases, migrants accept indentured servitude as compensation against an advance for coyote fees.  Such a transaction is 'voluntary', in the sense that it was the only currency the migrant could produce to pay a crossing fee.  

Rape / Coerced Sex

As part of the fees to guides (coyotes) for passage across the border, women are routinely expected to provide sexual services during the crossing.  Various sources put the estimates of coerced sex at 30-80%, with 60% the most common number.  Women constitute only 27% of those apprehended and thus presumed to attempt crossing the border.  Even so, a 60% coercion rate translates into 118,000 cases of rape or coerced sex per year.

Drug Smuggling / Extended Incarceration

If women are expected to provide sexual services as part of the coyote fee, men have traditionally been expected to carry drugs across the border.  A decade ago, this percentage was probably around 75%.  With legalization of marijuana, this number has fallen, but a precise estimate is problematic.  We think that perhaps 15% of migrant men are compelled to carry drugs today, but both a higher and lower case could be defended using reasonable assumptions.    

A migrant caught carrying 40 lbs of marijuana could face a very stiff prison term, up to 20 years.  Therefore, a key risk is extended incarceration -- which we deem as one month or more.  The US Border Patrol accepted 74,000 prosecutions in 2016, and we think 2018 will see a similar number.  To this can be added those incarcerated in US state and local prisons and in Mexican jails.  While we use 76,000 as our official estimate, the total number could be higher.  It is important to note that those incarcerated include a mixed group of migrants and professional smugglers.  Even so, the number of economic migrants incarcerated for an extended period due to immigration or drug charges probably exceeds 50,000 per year.

Border Arrests

Between the Mexican police and US Border Patrol, nearly three-quarters of undocumented migrants will be detained at some point.  This represents about half of all adverse events suffered by migrants.

Abandoned Trip

About 10% of crossers are thought to abandon their efforts en route.  This may be due to predation suffered in Mexico, for example, from being robbed or kidnapped, or fear of being arrested trying to get into the US.  This will often involve a loss of funds, including the coyote fee, representing perhaps six months of labor.  In addition, a failed entry is likely to be perceived as a personal failure or trauma by the affected individual.

Excluded Items

The above are not necessarily a comprehensive list of trauma suffered by migrants.  The following are not included:

  • Predation of Hondurans and Salvadorans crossing Guatemala
  • Miscellaneous types of harassment, price gouging and fraud
  • Some adverse events suffered by 'inadmissibles' (those trying to get through at official crossing points), including detention
  • Predation suffered by migrants already resident in the US

*****

In all, we estimate economic migrants will suffer 1.1 million traumatic or adverse event trying to reach the US in 2018.  This represents a predation rate of 144%.  That is, those 711,000 migrants attempting to cross illegally into the US this year will suffer on average 1.4 adverse events during the journey.  In a typical case, they are likely to be detained by US Border Patrol and commonly suffer another adverse event like rape or robbery.

These statistics speak to a global scale humanitarian crisis on our borders, second only to the chaos engulfing Venezuela in our hemisphere.  

US immigration policy is directly responsible for 95% of the predation listed above.  Modifying US immigration policy -- in a way which our research indicates will be supported by conservatives -- would all but end migrant predation completely.  

*****

Supporting assumptions, data and analysis are in the file below:

Migrant Predation - Sources and Methodologies (Aug. 2018)

We welcome any thoughts, questions or additional insights our readers may bring to the topic. 


SWB July Inadmissibles: Zero Tolerance deterred Asylum Seekers

Inadmissibles are those migrants who show up at official crossing points but are denied admission for lack of appropriate documentation. 

Back in April, Attorney General Jeff Sessions announced a 'zero tolerance' policy at the US southwest border, including separating parents from children.  How did this policy work out? 

If we project out the whole year based upon the first four calendar months, then we can see that in fact May-July inadmissibles came in well below forecast, 20% below for the May-July period and an impressive 33% below expectations in July alone.  A more harsh US policy motivated about 8,000 asylum seekers to defer their attempt to enter the US during the May-July period.

July Inadmissibles.png