Rigs, Spreads, and March DPR: Huge Shale Oil Supply Revisions

Readers will recall that, for the last several months, I have noted that US oil production per the EIA's weekly Petroleum Status Report was inconsistent with the data from the EIA's monthly Drilling Productivity Report (DPR) 

The graph below shows that state of play as of last week.  The two red arrows at right show the contradictory trends, with total oil production essentially flat while shale oil production is shown rising at a healthy clip.  I have noted that this contradiction would have to be resolved by either increasing the weekly numbers or reducing shale oil output.  

We now have the answer.  

The graph below shows the state of play as of March 14th, when the EIA issued the March DPR.  It shows simply massive downward reductions in US shale oil output.  In the March report, shale oil output from the key plays is reduced by 443,000 bpd for January and 250,000 bpd for February.  If we go back one more month to the January DPR, shale oil production has been reduced by 542,000 bpd for December 2022.  This is a huge revision, more than 4% of total US crude and condensate production over a two month period.

With this revision, as the current graph (below) shows, US shale oil production is largely flat over the last four months, and trends in shale oil supply are consistent with the overall US crude oil supply (including conventional onshore wells, Gulf of Mexico offshore, and Alaska).  I need hardly point out that this is not good news, as the visible peak of horizontal oil rigs is now beginning to pair up with plateauing oil production, just as we would expect.  

The most plausible interpretation is that US crude and condensate production will stagnate for the balance of the year.  As I wrote in The Oil Supply Outlook (Feb. 2), the plateau has been expected since at least 2017 (see Fig. 6), so it should come as no surprise.  I think the surprise, however, will be in production trends going forward.  The EIA sees a long plateau in US oil production.  I think it more likely that we'll see the beginning of an erosion in supply from 2024.

In light of this, President Biden's approval of drilling in Alaska is not hard to understand, but don't expect it to have a material impact on supply anytime soon.

*****

Rig and Spread Counts (for March 10)

  • Rigs counts fell again

    • Total oil rig counts fell, -2 to 590

    • Horizontal oil rig counts were flat at 551

    • The Permian shed 3 horizontal oil rigs.  Not good.

  • The pace of horizontal rig additions fell to -3.0 / week on a 4 wma basis.  

    • This number has been negative for 13 of the last 14 weeks

    • As before, our model suggests that rig counts could erode at a pace of -1 / week for the next two months

  • Frac spreads were flat at 276

  • DUCS were up 9 for the month of February, essentially flat as a statistical matter.

    • At current rig and spread counts and productivity levels, we would expect the DUC inventory broadly flat in the coming month


Rigs and Spreads March 10th.pdf

EIA PSR Week of March 3rd: Steady

  • Crude inventories fell marginally this week

  • Nevertheless, excess crude inventories, as measured by seasonally-adjusted days of turnover, rose 6.7 mb on flat refinery runs at a time when they should be rising seasonally.

  • Product inventories are normal

  • Excess inventories in in aggregate were up 10.6 mb, a pretty hefty, but not unprecedented, gain

  • Total, gasoline, and distillate consumption (supplied) were all down this week but still look good on a 4 wma basis

    • Gasoline supplied in particular is looking healthy, generally a positive signal for the economy

  • US crude and condensate production declined by 0.1 mbpd to 12.2 mbpd, materially unchanged since last August

  • Oil prices remain range-bound.  

    • The futures curve remains in soft contango, with the market expecting normal supply/demand conditions to return in the second half of the year

Russia oil production grows, returns to near pre-war levels

The EIA, the analytics arm of the US Department of Energy, published the February oil markets data in its latest STEO (Short-term Energy Outlook) yesterday.  The EIA reports that Russian oil production rose to 11.13 mbpd in February, the highest since April 2022 and a whopping 1.1 mbpd higher than the EIA's forecast from two months ago.

In fact, as visible on the graph above, the EIA has been 'forecast surfing' since last July.  That is, the EIA anticipated that embargoes and price caps would precipitate production declines, particularly related to the more difficult market in refined products.  Month after month, the EIA forecast that, although production declines had not yet kicked in, they would soon begin.  Thus, the EIA has published a series of forecasts showing a cascade of anticipated production declines, with the Russians thwarting expectations month after month.  The visual impression, as one can see on the graph above, is of a kind of 'forecast surfing', as though the actual data were surfing on an ocean wave.

Why has the EIA proven so wrong to date?  And why has our forecast from last July -- the Black Market line on the graph -- proven so much more accurate?

In general, the EIA's track record for forecasting is about as good as one will find, whether from the investment banks like Goldman Sachs or from specialised consultancies like S&P Global.  The EIA is staffed with competent, dedicated professionals with long-tenure as a rule.  So why the miss month after month for Russian oil production?

The EIA's models are built on market forecasts, emphasizing elements like customer requirements and tanker availability.  There is nothing wrong with this, as oil is normally traded under market conditions (with some exceptions regarding OPEC).  By contrast, our forecast from last July is a black market forecast, that is, it operates under a different set of assumptions.  Chief among these is that prohibitions -- whether on quantities like the EU embargo or on prices like the oil price cap -- tend to lead to evasion accompanied by vast corruption and unbounded hypocrisy.  Thus, we assumed that the Russians would find a way around the sanctions, and the numbers to date suggest this in fact has happened.

The shape of our forecast comes from historical data on black markets, most notably from the US Prohibition era, when alcohol consumption was illegal in the United States.  As the graph below shows, Prohibition was initially successful, but within two years consumption had returned to levels only modestly below that of the pre-Prohibition era.  

The Russian production data show a similar pattern, with the exception that the recovery took two months, not two years​. This is no surprise​, given that the various oil sanctions do not apply to much of the globe, including India, China and the Middle East.   Overall, however, we see the same pattern: initial success ​of the sanctions ​followed by a supply recovery to a level modestly lower than the pre-prohibition state.   We made our Russian oil forecast using this approach, and to date it has held up better than the EIA's numbers.  This, again, is not due to superior forecasting technique, but rather the use of an entirely different forecasting paradigm.  

Forecasting is, of course, a precarious ​endeavor.  The Russians have announced oil production cuts equalling 650,000 bpd, and these should begin to manifest in the March data.  If the EIA is not entirely right, it may not be entirely wrong either.  Still, the Russians are likely to find ways around embargoes and price caps.  The more time passes, the more successful they will be.  That is what a black market model suggests.

All of this is of moderate interest.  Of greater interest are the other manifestations of black markets.  For example, the model suggests that the sanctions and price caps are drawing China into the war on the Russian side -- a topic which we will address in another post.

Rigs and Spreads March 3: The unwind continues

  • Rigs counts fell this again week

  • Total oil rig counts fell, -8 to 592

  • Horizontal oil rig counts also declined, -5 to 561

  • The Permian shed 4 horizontal oil rigs.  No good.

  • The pace of horizontal rig additions fell to -1.25 / week on a 4 wma basis.  

    • This number has been negative for twelve of the last thirteen weeks

  • As before, our model suggests that rig counts could erode at a pace of -1 / week for the next two months

  • Frac spreads were up, +4 at 276

  • At our estimates of rig and spread productivity rates, DUCs would again appear to be falling, and from low levels at that.  Next week’s DPR should confirm or refute DUC trends, but an industry unable to hold even modest inventory levels can be presumed to be in bad shape.

EIA PSR Week of Feb. 27: Plus ça change

Not much change this week.  Excess crude inventories fell marginally; production was unchanged.  The only newsworthy item was gasoline supplied (consumption) which looked the best since the start of the war.

  • Crude inventories were flat this week

  • Excess crude inventories, as measured by seasonally-adjusted days of turnover, fell 2.7 mb.  Seasonality accounts for the modest decline.

  • Crude inventories remain well below long-term levels, but are creeping up

  • Product inventories are normal, with distillate a bit tight

  • Excess inventories in aggregate are a bit high but moving sideways

  • Demand (product supplied) in general is perhaps a bit improved.  

    • Total product supplied is up, but still 3% below normal

    • Distillate supplied remains 7.5% below normal, but recovering

    • Gasoline was the bright spot this week.  Gasoline supplied remains 2.2% below normal (4 wma basis) but is the highest since the start of the war.  The last two weeks have been marginally above normal, suggesting strength in the economy.

  • US Lower 48 crude and condensate production remains unchanged at 11.9 mbpd, as does total oil production at 12.3 mbpd 

  • Oil prices have firmed but remain range-bound.  

    • Strength in gasoline consumption suggests higher prices, but the futures curve remains in soft contango

    • The Russians have announced production cuts which come out to 650,000 bpd as a result of being unable to fully place their refined products in global markets following the Feb. 5 EU products embargo.  (Kudos to the EIA on this call, at least to date.)  Let’s see if it moves prices . 

  • Bottom line: Not much change since last week

The Economics and Exploitation of Undocumented Migrant Child Labor

The New York Times recently published a feature piece entitled Alone and Exploited, Migrant Children Work Brutal Jobs Across the U.S. The article essentially amounts to a classic exposition of the black market in migrant labor and is all but a poster child for market-based visas.

Due to various legal rulings over the last two decades and especially permissive policies under the Biden administration, unaccompanied minors can enter the US and remain in the country for years at a time. By providing preferential treatment to minors, the government has created a bias towards child migrant labor. Indeed, the prospect of work is the principal cause of illegal entry, with the NYT noting that "in interviews with more than 60 caseworkers, most independently estimated that about two-thirds of all unaccompanied migrant children ended up working full time."  The share could be even higher.  In north Grand Rapids, according to the article, "93 percent of children have been released to adults who are not their parents."  Thus, family reunification is not the primary motivator of child migration.  Rather, even for minors, the whole point of entering the US illegally is to find work.  Illegal immigration is a black market in migrant labor -- whether for minors or adults -- as we have always contended.  

The article then goes on to detail all the ills of such a situation: debts incurred that must be repaid by these minors, long hours, dangerous work, exorbitant lodging fees, false identification expenses, and "sponsor" fees. In addition, many of these minors are hired by staffing agencies which launder their credentials to allow them to work. That is, the migrants are hired by an agency -- not by the ultimate employer -- with the agency providing 'assurances' to the employer that the migrant is both legal and of age. The agencies will, of course, take their cut of the migrants wages. A big cut. Think Pablo Escobar meets Robert Half.

Further, we can assume other issues. The first is wage theft by direct employers, most notably by staffing agencies. Wage theft occurs when promised wages are not paid in full. This is typical for migrant labor in the US and has historically been one of the major complaints of undocumented workers. In addition, large-scale sexual exploitation of underage female migrants is all but certain. As noted above, minor girls are being released in the US, in most cases, to the care and households of people who are not their parents and in many cases may be presumed to be part of labor smuggling groups. Female minors will be poorly positioned to resist advances and coercion from sponsors or other persons residing in the household.

How are we to make sense of this catastrophic situation?

As ever, we can bundle all these issues into a financial analysis to understand the dynamics of exploitation.

Right now, minimum wage labor can command around $15 / hour in the US. If a staffing agency is used, figure they take 40% of the gross or $6 / hour to front for undocumented, under-age labor. The sponsor may take another $2 / hour and an inherently higher cost of living in the US, another $2 / hour.

Thus, of the $15 / hour gross wage, the minor is left with perhaps $4-6 / hour, $5 / hour per our model. This becomes cash available for remittances.

All this is lousy from the US perspective, save that net US wages for undocumented minors are still double the wage available for unskilled adults in Guatemala. Therefore, undocumented minors have an economic incentive to endure their harsh reality in the US. The current system is perverse and degrading, but it is economically workable, which is why 250,000 unaccompanied minors have entered the US over the last two years.

The costs, however, are more than those counted in cash. Non-cash exploitation and trauma costs must also be factored in. As noted above, the risks would appear greatest for undocumented girls, particularly related to sexual harassment or coercion. The NYT's article alludes to the brutal reality:

It has been a little more than a year since Carolina left Guatemala, and she has started to make some friends. Mostly, though, she keeps to herself. Her teachers do not know many details about her journey to the border. When the topic came up at school recently, Carolina began sobbing and would not say why.

Do we not know why? Prior to the current system, when adult women from Mexico and Central America paid coyotes to guide them across the Sonoran desert to Arizona, stories of sexual assault were common. But so was the tendency of victims to internalize the trauma and bear the scars in silence for fear of social stigma and humiliation. The current system is potentially worse -- far worse -- as we are now speaking of minors literally living with 'sponsors' as all but indentured servants and enjoying virtually no legal protection. As many as 50,000 under-age girls may be at serious risk. The NYT's article does not tell us whether this is in fact happening, but the analytics suggest sexual exploitation is widespread.

The system works as it does because the US has, in effect, privatized (more precisely, waived) the value of the work permit, enabling sleazy intermediaries to capture its value. The right to work in the US is extremely valuable, as I often point out. Indeed, the value of the visa in principle could be as high as the predation cost shown above, $20,000 / year. If the US government does not claim that value, someone else in the supply chain -- cartels, guides, smugglers, sponsors, staffing agencies, or direct employers -- will tend to capture it. This is the fundamental economic reality of illegal immigration.

In a market-based system, the situation would be quite different. To begin with, such a system would eliminate minors. Market-based work visas would have an age minimum, probably 18. Therefore, minors would be screened out, just as they should be. Moreover, such a system would allow migrants to work for any participating company, whenever they want (subject to annual time limits). There is no indenturing effect. Migrants can come and go as they please and enjoy full US legal protections in the process. This improves the lot of the migrants because they have leverage with their employer -- they are not tied in debt bondage -- and they have legal protection from criminal behavior, including sexual assault.

The New York Times article -- I encourage you to read it -- frames the current system as some inexplicable social dysfunction, the result of evil sponsors and employers exploiting vulnerable children. It most certainly involves exploitation, but the US system is working exactly as US policy-makers have designed and implemented it as a practical matter. The article catalogs the classic adverse effects of prohibitions and resulting black markets. The system is not anomalous. It is operating exactly as black market theory predicts.

Ending the use of undocumented, minor labor is straight-forward. Central Americans do not send their children to work in the US because they are heartless. They send them because the adults are unable to enter the US to work. If we transition to a market-based, legalize-and-tax system, ending the employment of undocumented children is trivial. Ending the associated exploitation and the suffering, for both minors and adults, is inherent in the approach.

We are finally at a stage at which social conservatives are willing to take a look at a market-based approach. This is truly incredible and real open-mindedness from those pegged as narrow and prejudiced.

But where is the political left? Where are all those who claim to care about the undocumented? When will they stand up and say that a legalize-and-tax, market-based approach is worth a serious look? Or will they look away as long as they can claim to be 'nice' by letting unaccompanied minors into the US, and ignore the tragedies suffered by these exploited children?

Rigs and Spreads Week of Feb. 24: Yuck

The rig and spread data look, frankly, like garbage.  Rigs and spreads are unable to hold level, and our analysis suggests DUCs are at best hanging on by their fingertips and actually appear to be eroding at our estimates of rig and spread productivity.  The breakeven to add rigs has averaged $78 / barrel WTI for the last two months (and higher before).  The shale oil sector clearly depends on a high oil price.  Long gone are the days of $40 / barrel breakevens.  Fair enough, the Permian continues to add supply at a decent pace, but for how long?  

Matt Johnson of Primary Vision, the industry's go-to source for frac spread data, sees no joy on the horizon either, noting that

“The rig count is middling at best, service prices are depressed even as providers continue to struggle with supply chain and labor woes, and operators are being so tight with their money. Spread count might not go anywhere this year.”

*******

  • Rigs counts were down this week

    • Total oil rig counts fell, -7 to 600

    • Horizontal oil rig counts also declined, -6 to 566

    • The Permian shed 1 horizontal oil rig

  • The pace of horizontal rig additions fell to -1.0 / week on a 4 wma basis.  This number has been negative for eleven of the last twelve weeks

  • The breakeven to add horizontal rigs came in at $78 / barrel on a WTI basis with $76 on the screen

    • Our model suggests that rig counts could erode at a pace of -1 / week for the next two months

  • Frac spreads were flat at 272

  • All of this paints an unfavorable picture of the US shale oil sector

EIA PSR Week of Feb. 17: Will WTI fall into the $60s?

  • Crude inventories built again this week, up 9 mb

  • As last week, excess crude inventories, as measured by seasonally-adjusted days of turnover, rose 2.2 mb.  Seasonality and rising runs account for the lower gain in excess inventories measured by turnover days.

  • Excess crude inventories have risen for 9 of the last 11 weeks

  • Crude inventories remain 250 mb below long-term averages, although this does not matter much for operating inventories as US oil consumption remains about 1 mbpd below normal

  • Product inventories are normal, with distillate a bit tight

  • Demand (product supplied) looks a bit brighter, but keep in mind that refiners and distributors probably stuffed retail channels ahead of the President’s Day holiday on Monday, thereby inflating the appearance of improving consumption.  Let’s see whether this reverses next week

  • US Lower 48 crude and condensate production rose 0.1 mbpd to 11.9 mbpd, although total oil production was unchanged at 12.3 mbpd (due to a bit less production from Alaska).  This was the highest L48 production in almost three years, although still 0.7 mbpd below the prior record set in Feb. 2020.  

  • Oil prices continue to erode with the futures curve in soft contango, as has been for the last several weeks.  

    • Doesn't look like Russian product exports are declining in any material fashion.

    • The data suggests that the WTI price could start with a “6” (ie., sub-$70) in the next couple of weeks.  If it does so, that would mark an entry point for the next cycle.

EIA PSR Week of Feb. 17th pdf

Rigs and Spreads Feb 17th: Not much news

  • Rigs counts eased back after large gains last week

  • Total oil rig counts fell, -2 to 607

  • Horizontal oil rig counts declined marginally, -1 to 562

  • The Permian shed 1 horizontal oil rig

  • The pace of horizontal rig additions rose to +0.75 / week, the first time this metric has been positive in the last ten weeks.

  • The breakeven to add horizontal oil rigs rose to $79 / barrel on a WTI basis with $76 on the screen

    • Our model suggests that rig counts will remain flat to down for the next two months or so

  • Frac spreads rose, +6 to 272, still no higher than a year ago

  • Rig and spread productivity numbers suggests DUC inventory may begin to erode once again, although the EIA reports DUC counts up modestly over the last three months

  • The EIA published the February Drilling Productivity Report (DPR) this past week

    • In the February DPR report, crude and condensate production from key shale plays rose to 9.03 mbpd in January, up 87 kbpd from December.  Total shale oil production growth has averaged 64 kbpd / month over the last three months

      • However, the EIA revised down historical shale production quite sharply, on average by more than 100 kbpd for November and December.  As such, reported shale production for January is actually below the prior estimate for December’s output.

    • Permian production was up 35 kbpd in January.  

      • Permian production growth has averaged 40 kbpd per month over the last three months, but the pace appears to be decelerating.  

      • The current trend line suggests Permian production could peak in Q3 or Q4

Rigs and Spreads Feb 17th pdf

EIA PSR Week of Feb 10th: Crude builds not as bad as the hype

  • The media reported a ‘massive’ crude inventory build this week, and indeed crude inventories rose by 16 mb --  a large, but not unprecedented, gain

  • However, excess crude inventories, as measured by days of turnover, rose only 2.2 mb because

    • Inventories tend to build seasonally in the spring, and refining, although still weak, has improved by 1.5 mbpd over the last month

    • As a result, additional crude inventory is needed to operate the system, and the net rise, after accounting for increased crude demand from refineries and seasonal factors is only a fraction of the nameplate 16 mb build

  • Product inventories are normal, with jet fuel a bit tight

  • Demand (consumption) remains weak, with total product supplied 5% below normal; gasoline 8%, distillate (diesel) 12% and kerosene (jet) 8% below normal on a 4 week moving average (wma) basis.  All of these remain stuck in recession territory, that is, pump prices remain high enough to prevent a full recovery of US refined products consumption, in aggregate running about 1 mbpd below normal

    • Having said that, weak diesel consumption is likely linked to warm weather in the northeast, where heating with fuel oil is common.  Too much should not be read into low diesel consumption

    • Further, although jet fuel consumption remains below normal on a 4 wma basis, it has actually posted above 2019 levels (‘normal’) for the last two weeks.  That’s a good sign both for recovery from the pandemic and indicative of discretionary income in consumers’ pockets

  • US oil production remains at 12.3 mbpd, up a bit over recent times, but still treading water overall

  • WTI remains in soft contango, and incentive to store analysis suggests supply continues to run ahead of demand by perhaps 1.5 mbpd globally.  If Russia’s exports do not fall, there is a $10 / barrel downside scenario in the short run.

Russia Federal Budget January 2023

A month ago, the Russian government reported the federal budget deficit at 2.3% of GDP for 2022, suggesting that Russia was coping with the fiscal impact of the war rather easily.  However, the annual numbers hid important trends.  To begin with, the war started in late February, and as a result, Q1 financials were largely unaffected.  Q2 saw high oil prices and stratospheric gas prices.  By Q3, however, oil and gas prices were falling, and sales volumes were tapering.  My earlier analysis of Q3 trend data suggested a 10% budget deficit at the time, but it was not clear whether this was in fact the case.

The January fiscal data suggest the Russian budget is indeed under considerable stress.  The Russian Ministry of Finance reported that, compared to January 2022, total federal government revenues are down 35%, and within this, oil and gas revenues are down 46% and tax revenues have fallen 28%.  That would be bad enough.

​​However, the spending side is also out of control, with January expenses up 59% on January 2023, in large part associated with keeping hundreds of thousands of troops armed and fed in the field​.  The result is a budget deficit running at a pace of 13.7% of GDP.   That is very large for a country without access to global credit markets.  

Russia still has various bank reserves, some ability to raid the coffers of state-owned companies like Gazprom and Rosneft, and the balance of Russia’s sovereign wealth fund.  This latter fund is reported to have a balance of $148 bn as of last month, that is, enough to cover half the deficit Russia would incur in 2023 if January’s deficit proves typical for the balance of the year.  As a result, the sovereign wealth fund will likely be drawn down to near zero, if not in 2023, then likely by mid-2024.  Putin’s reluctance to call another mobilization may be related to financial constraints, as conscripting half a million working age men and provisioning them in the field could only make the deficit that much worse.  

A recovering oil market may yet save Russia, but for the moment, oil prices remain restrained and the price cap appears effective.  Without materially higher oil prices, Russia faces difficult fiscal conditions in 2023.  By 2024, the situation is likely to be dire.

Rigs and Spreads Feb 10th: Rigs up, Spreads down

  • Rigs counts recovered

  • Total oil rig counts rebounded, +10 to 609

  • Horizontal oil rig counts similarly rose, +7 to 563

  • Net all 7 of the added horizontal rigs were from the Permian.

  • The pace of horizontal rig additions rose to -0.5 / week on a 4 wma basis, with this metric in negative numbers for the last two months

  • The calculated US breakeven to add horizontal oil rigs rose to $74 / barrel WTI versus $79 on the screen at writing.  

  • Frac spreads fell, -4 to 266, still no higher than a year ago

    • As with rigs, the local peak was reached on November 25th at 300 spreads.  

    • With the loss of spreads and rise in rigs, DUC counts appear stable

  • The overall thesis is unchanged.  The shale sector looks to be in trouble.

Washington Examiner highlights legalize-and-tax to end illegal immigration!

The Washington Examiner has run a lengthy piece on market-based visas --- a legalize-and-tax system --  calling it a potential compromise to close the border to illegal immigration.  Based on one of my earlier notes rounded out with additional commentary, How Biden could fix the border and get taxpayers $100 billion has a 'like' to 'dislike' ratio of 9:2 as republished on MSN.  That's an 82% approval rate from the public for an approach which most of my professional readers consider radical.  

It is hard to overstate the importance of this article, considering how it closes: 

[Legalize-and-tax] might offer a compromise for both political sides by pushing illegal immigrants to enroll in the visa program or face deportation. “Long-term undocumented will face a choice: Take a work permit at a price they can afford or be deported. This is not a hard decision,” [Kopits] said, adding, “As the precedent of California's botched marijuana legalization shows, closing the border to contraband, whether marijuana or undocumented labor, is not enough to end the internal black market — in our case, the employment of undocumented residents without work permits. The prohibition on both new and existing migrant labor must be lifted to regain control over the border and bring order to the internal U.S. labor market.”

This is the stalwartly conservative Washington Examiner stating that we -- both the left and right -- need to formally consider a comprehensive solution using market-based mechanisms to end illegal immigration across the border and contemplate the near universal granting of work permits to long-time undocumented residents to clear the internal market.  That's a big deal.  A very big deal.  This is vastly more ambitious than DACA or the Dreamers, and yes, you are reading about it in a hard-nosed, socially conservative paper.  

Why, and why now?  

The article's author, Paul Bedard, writes the "Washington Secrets" column for the Examiner.  I've known Paul for several years now, and he regularly covers my monthly border apprehensions reports.  He is the quintessential Washington insider (hence the 'secrets') and has his finger on the pulse of the conservative base.  He has read most of my work on illegal immigration for the last five years and knows the legalize-and-tax thesis.  I think he has focused on the idea for a number of reasons.

First, my border apprehension forecasts have proved accurate over the last several years, and certainly, that helps one's credibility.

Second, I think Paul has become more comfortable with the notion of illegal immigration as a black market in labor, one which can be addressed as we have other black markets, notably for alcohol, gambling and marijuana.  That insight, that illegal immigration is like other problems which we have successfully resolved, I think has been central to Paul's thinking.

Third, no one has a compelling alternative.  This is no surprise, because legalize-and-tax is materially the only proven approach to end black markets.   Neither more enforcement nor greater leniency will solve the issue, and we know because it has not for the last 58 years.  For all the vitriol, protesting, and editorial ink spilt over illegal immigration in recent decades, the border situation today is the worst ever by a substantial margin.  We need a collective solution.  Legalize-and-tax is the only one on offer.

My takeaway therefore is that Paul believes conservatives are willing to take a serious look at a market-based solution to illegal immigration.  The approval rating on the article suggests that the public agrees.  

It's time to move forward, and time for the pro-migrant side to weigh in.

Rigs and Spreads Feb. 3: Worrying

Rigs counts were down

  • Total oil rig counts fell sharply, -10 to 599

  • Horizontal oil rig counts also fell, -4 to 556

  • 3 of 4 lost horizontal rigs were from the Permian.  Worrying.

  • The pace of horizontal rig additions fell to -1.75 / week on a 4 wma basis

  • The rig count has been eroding now for 2½ months

  • The calculated US breakeven to add horizontal oil rigs fell to $73 / barrel WTI versus $73 on the screen at writing.  

  • Frac spreads fell, -8 to 270, still no higher than a year ago

    • As with rigs, the local peak was reached on November 25th at 300 spreads.  

    • At current rig and spread counts, at latest productivity levels, DUCs appear to be falling once again

  • The data suggests the US shale sector is at a turning point

    • WTI has averaged $85 / barrel (with a lagged value) during the last ten weeks in which rig and spread counts have been declining.  This is a high price by historical standards.  Nevertheless, declining rig counts say it is not high enough.

    • This development is unprecedented since the beginning of the shale revolution for oil, around 2010. In 2018, for example, the rig count was rising at $60 / barrel; now it is falling at $85 / barrel, and from a lower level

    • The latest US data for November and December show declining oil production, down about 300 kbpd compared to October.  This is historically unusual.

    • Trouble is brewing.

The Oil Supply Outlook (and why it matters for Ukraine)

Perhaps nothing will influence the medium to long term prospects of Ukraine more than the oil price. If prices rise to $140 / barrel, as Pierre Andurand, the world’s best known oil trader, suggests, then the EU / US embargoes and price caps on Russia oil will prove politically untenable, and Russia’s financial resources will be all but unlimited.

In my last Ukraine-related post, I looked at demand and assessed Andurand's claim that oil demand could rise by a hefty 4 million barrels per day (mbpd) this year. 

In this post, we look at the oil supply. What is the outlook for growth? Will it be able to keep pace with demand, or are prices set to rise towards $140 / barrel?

The Historical Context

As the graph below shows, until 2005, the global oil supply was growing at a solid pace, with gains coming principally from OPEC and post-communist Russia.  During this time, US oil production was declining, as it had been for many years, by about 0.1 mbpd on 9 mbpd of total petroleum liquids output.  The decline was slow, but perceptible and inexorable.

In 2005, all that changed.  Russia and OPEC were no longer willing or able to add supply in the medium term, and the US could only watch its own resources decline.  For four years, from 2005 until 2009, the oil supply barely budged.  This culminated in the oil price spike of 2008, when the US benchmark WTI oil price hit an all-time record of $147 / barrel. Two months later, the global economy was consumed by the Great Financial Crisis.

Figure 1.

Source: EIA

The financial crisis morphed into the Great Recession. Oil producers scrambled to cut production in the hopes of propping up plummeting oil prices. This ultimately proved successful, and by 2010, the global economy was growing again. Oil production recovered with economic activity.

Nevertheless, the oil supply was once again unable to keep pace with the recovery of the global economy, and by 2011, the European Brent benchmark had soared to $110 / barrel. It would remain in this range for the next three and one half years, through June 2014.  During this period, the US struggled with 'secular stagnation', and Europe entered yet another recession, even worse than the one it had just exited.  The economic stresses of high oil prices were evident.

Salvation came from an unlikely source: the US.  Although US oil reserves are among the smallest of the major producers, they are efficiently exploited, and US innovation and entrepreneurship are unmatched.  US oilmen discovered that they could extract natural gas from rock -- shales -- and then applied that knowledge to extract oil using horizontal drilling and hydraulic fracturing -- 'fracking'.  Fracking was wildly successful.  From 2008 to 2022, the US added 11.7 mbpd to the oil supply (comprising crude oil and condensates from oil wells and natural gas liquids (NGLs) from gas wells).  To put it in context, US shale production growth since 2005 exceeds the total production of Russia or Saudi Arabia.  By itself, US shale liquids (crude + NGLs) would be the world's second biggest producer after the United States.  

In fact, US shales have provided more than 80% of the incremental world oil supply since 2005.  US shales, along with Canadian shales and oil sands, have provided effectively all of the net incremental oil supply since 2005.  In the last seven years, US shales have carried the global oil system single-handedly.  

Of course, other countries also added production.  The Russians contributed modestly, and the Brazilians a bit more.  But one group contributed effectively nothing: OPEC.

The OPEC supply of petroleum liquids (crude oil + natural gas liquids) was essentially the same in 2022 as it had been in 2005.  OPEC has added nothing to the global oil supply in seventeen years.  Indeed, Saudi Arabia is pumping about as much today as it was in 1979, before the second oil shock.  It is true that OPEC was pumping 3 mbpd more in 2016 than it is today, and that OPEC has the capability of expanding production to an extent.  But the underlying reality is far from what most people think.  OPEC supply has not changed much in the last seventeen years.  US shales, by contrast, are still considered the newcomer, a nice addition to the oil supply, but are thought of as just the icing on the OPEC cake.  Nothing could be farther from the truth.  The global oil system has been fully dependent for growth on US shales since 2005.  

Looking Forward

What can we expect from the world oil supply in the coming years?

This hinges, first and foremost, on trends in US shale oil production.  Shale oil comes essentially from just five plays, the Permian, Bakken, Eagle Ford, Niobrara and Anadarko (using EIA nomenclature).   The Permian, in west Texas, is by far the most important.

Figure 2.

The EIA has muted expectations for US oil production growth in 2023, with supply in October 2023 forecast to be only 0.1 mbpd higher than this past November.  That will not come even close to the 1.9 mbpd of demand growth the European IEA expects this year.  

Figure 3.

Source: Various editions of the EIA monthly STEO

On a longer horizon, the situation is potentially even more problematic.  Not all shale plays are the same.  The key shale plays other than the Permian -- that is, the secondary plays comprising the Bakken, the Eagle Ford, Niobrara and Anadarko -- are producing 0.9 mbpd less than their peak production in October 2019.  They are more than three years past peak production.  Indeed, the secondary plays are collectively producing less than they did eight years ago. Although their production is recovering modestly, they are unlikely to ever regain earlier highs.

Figure 4.

Source: EIA January 2023 DPR

As a result, the Permian basin has been left to meet global demand by itself, and it has successfully done so since 2015.  The question is how long the Permian can continue to do this.  As the graph above shows, Permian production growth has been solid, adding about 40,000 bpd every month, potentially 0.5 mbpd for 2023 as a whole.  Nevertheless, the drilling rig count in the Permian (below) is largely unchanged since June.  If rig counts remain stuck at their current level,  production may also be expected to plateau within 12-18 months, that is, the Permian could reach its maximum output this year. In fact, some analysts have begun to question whether peak US production has already arrived or is perhaps just a few months ahead of us. Historically unusual production declines in November and December are consistent with this view.

Figure 5.

Source: Baker Hughes, Bloomberg

A peak would come as no surprise.  A plateau for US shale oil production has been forecast for the 2023-2025 time frame since at least 2017.  The EIA's forecasts from 2017, 2019 and 2022 can be seen below, and all of them expect US production to plateau by mid-decade.  Nor are EIA forecasts outliers.  Mainstream forecasters like Goldman Sachs have expected a mid-2020s peak since at least 2017.  Those who follow the data have known for years that US production could crest in the mid-2020s.  It has been expected for a long time.

Figure 6.

Source: EIA Annual Energy Outlook (AOE), 2017, 2019 and 2022 editions

If US production can no longer meet incremental demand growth, what other countries could step up?  

Brazil and Canada are the key countries outside the OPEC+ cartel.  Other major producers like China or Norway do not add much extra oil. In recent times, Brazil and Canada have been able to add 0.3 mbpd / year, just enough to offset declines elsewhere.  In a very good year, they might add net 0.4 mbpd.  Therefore, if the US is out of the picture, the remaining non-OPEC+ countries — principally Canada and Brazil — can be relied on to meet no more than one-third of incremental oil demand in a better year.

Figure 7.

Source: EIA

For the balance of needed barrels, the world must look to Russia and OPEC.

Russia is, of course, under sanctions, but production there is only 5% below expected levels.  As a result, Russia's spare capacity is minimal, even if it were able to freely export.  Further, Russian oil production under Putin has tended to show steady growth of about 0.2 mbpd / year, and we might expect similar growth in the future, all other things equal.  The war, however, has adversely affected the outlook.  Sanctions have delayed a number of Russia's more sophisticated projects, and Russia’s wartime fiscal needs are likely to cannibalize at least part of the capital expenditure programs of companies like Gazprom and Rosneft.  Consequently, stagnation or even decline in Russia output would come as no surprise.  For planning purposes, a meager Russian addition of 0.1 mbpd / year might appear plausible for the balance of the decade. This is far from sufficient to meet world demand growth.

That leaves OPEC.  

OPEC produced 2 mbpd above current levels before covid, but cut production to counter weak demand associated with the pandemic.  As a result, OPEC has excess capacity of 3 mbpd, of which approximately 1.5 mbpd could be brought back on line over a period of 6-18 months.  This is enough to meet the IEA's anticipated demand growth of 1.9 mbpd for 2023 without any notable price shock.  

Figure 8.

Source: EIA

For Russia and OPEC, however, the question is intent.  All business cartels -- including OPEC -- exist to maximize selling prices by limiting production.  As a result, OPEC -- and now the OPEC+ cartel including Russia -- have an incentive to add production with a lag, that is, to allow growing demand to drive up oil prices, commit some capacity to slow the price rise, allow demand to grow again, and let oil prices rise again, and commit some additional capacity. The result is a gradual spiraling up of prices, with supply never quite catching up to demand.

By implication, those expecting OPEC to save the day and materially increase production over the next several years are likely to be disappointed.  OPEC's average additions are likely to be similar to those of the last ten or twenty years: +0.2 mbpd / year on average, with significant lumpiness.  OPEC's modest additions -- even supplemented by Brazil, Canada, and Russia -- are unlikely to keep pace with demand growth.

Instead, OPEC will be looking to recreate the conditions of 2011-2014, when oil prices averaged $110 / barrel.  Adjusted for inflation, that is $140 / barrel today, just the number Pierre Andurand highlighted.

This should not be taken to imply that oil prices will rise to $140 / barrel in the near term.  Supply continues to run ahead of demand, OPEC still has a comfortable spare capacity cushion, and the outlook for the global economy remains choppy. 

Nevertheless, the conditions are present for a material tightening of the market in the medium to long term.  After 2023, oil price trends favor Russia, and perhaps substantially so.  For Ukraine, this could pose a serious threat, as the current European and US sanctions on Russian oil are unsuitable to deal with such an eventuality.

California Pot's Lessons for Migrant Amnesty (Part I)

As readers know, we advocate for a legalize-and-tax system to close the southwest border to illegal immigration, just as it has for marijuana smuggling.  At the same time, we are witnessing the collapse of the legal marijuana system in California, and that carries important lessons for a market-based system to end illegal immigration.

An article from this weekend's San Francisco Gate decries a “mass extinction event” for California’s legal marijuana industry, with thousands of companies expected to go out of business this year.  The Gate flags the obvious reason: “You can't make any money in this market.”

The state’s complicated cannabis regulations and high taxes add costs to legal operators, while widespread illegal farms and retailers undercuts legitimate companies. Limited access to banking means these companies pay exorbitant fees for simple banking services and have almost no access to loans. Federal law blocks pot companies from deducting most business taxes from their federal taxes, making pot businesses pay an effective federal tax rate as high as 80%. 

Clearly, the authorities in California never bothered to conduct an analysis of the marijuana business to determine the maximum compliance costs and taxes which the market would bear.  This is not a hard number to calculate, and as always, we start with the consumer.  At issue is the premium the California consumer is willing to pay for legal marijuana.  Even a brief review of the literature suggests that the maximum viable premium is about one-third over the price of street marijuana, in dollar terms about $75 / ounce. To appearances, the authorities never set $75 / ounce as the maximum burden the legal industry could bear and instead just piled taxes and compliance costs onto legitimate producers and resellers.  As a result, legal pot costs $230 / ounce more than the street variety.  That mark-up is three times the number Californians are willing to pay.  No surprise, customers are returning to black market marijauna, and the legal industry is imploding.  California botched marijuana legalization because it ignored the economic realities of producers and consumers.  

These risks also apply to a legalize-and-tax system for illegal immigration. 

Given the strength of the US labor market, the value of a one-year work visa for a Mexican day laborer is probably in excess of $9,000.  That is, an unskilled Mexican worker would gladly pay the US government $25 / day for the right to work in the US on demand.  If background-checked migrants could purchase such a visa for $9,000 (not $1,000 as GMU professor Bryan Caplan would have it), the border would be effectively closed to illegal immigration.  

The border is not the issue.  We ended alcohol smuggling from Canada and Cuba with a legalize-and-tax regime, that is, with the repeal of Prohibition.  We have ended marijana smuggling over the southwest border with only partial legalization of marijuana on the state level.  We can end the smuggling of migrant labor over the border the same way.  That's not the problem.

Rather, the challenge is visa renewal.  If the incumbent black market is allowed to operate in parallel with a legalize-and-tax system, then migrants who paid $9,000 will be working shoulder-to-shoulder with undocumented immigrants who entered the US earlier and are paying nothing for the right to work here.  The risk is that legal migrants will allow their visas to lapse and join the undocumented: $9,000 is a big incentive to become illegal.

Therefore, the existing black market in labor must be addressed when a legalize-and-tax system is introduced. There are two options: deport the incumbent undocumented or, alternatively, legalize them with a work permit.

For conservatives, deporting illegals is the preferred option.  After all, these people are breaking the law and should be punished accordingly.  Much as this might provide moral satisfaction, it won't work, for several reasons.

First, any such proposal will fall to garner Democratic support.  Nor will it find sympathy with Republican moderates like Susan Collins (Maine), Lisa Murkowski (Alaska) and Mitt Romney (Utah).  Any initiative built on the deportation of 10 million undocumented migrants will never make it out of committee.

Second, mass deportation is unacceptable to the American public.  Readers will recall the migrant poultry raids of 2019 under the Trump administration.  These were widely condemned.  The US public is simply not prepared to stomach the arrest and expulsion of otherwise law-abiding people working at regular jobs and trying to provide for their families.  Such efforts will be criticized as "inhumane", "cruel" and "Gestapo actions".  Not surprisingly, these sorts of raids were quietly deprioritized following the uproar -- over only a few hundred migrants.  Imagine the challenges of trying to deport 10 million.

Third, employers will not release their labor until they know they have a replacement.  Entire industries depend on undocumented labor, and if ICE attempts to remove illegals at scale, the managers, owners, lobbyists and lawyers of those same industries will descend on Congress, the White House and the various bureaucracies like a plague of locusts.  And given that these same businessmen are prominent members of their local communities and important political contributors, politicians on the Hill, both Republican and Democrat, may be expected to fold like lawn chairs.  They have in the past.

Finally, apprehending undocumented workers fearing deportation is not easy.  They will flee and hide and arresting even ten thousand will prove a formidable task.  

As a result, the likelihood of dismantling the black market in migrant labor through deportation approaches zero.  It is not worth trying.  This has nothing to do with justice, fairness, or the sanctity of law, principles which I will readily concede to my conservative readers.  Instead, it is all about real world considerations.  The issue is not the best policy in abstract, but rather the best that can be achieved given realities on the ground.

The existing black market can only be dismantled, as a practical matter, by legalizing it, that is, by issuing work permits to those workers who have not otherwise committed serious crimes like murder, assault, theft or rape.  Workers will face a choice: take a work permit or be deported.  This is not a hard decision, nor is it hard for the employer.  Managers, as a rule, prefer to follow the law.  It has both lower criminal and career risk.  Human resources and operating managers will be grateful for legalization as long as it does not reduce their workforce or materially increase their costs, and legalization should do neither.  A legalize-and-tax system can 'drain the swamp' of illegal labor, but will only succeed by legalizing most of the long-term undocumented in the country.  

As the precedent of California's botched marijuana legalization shows, closing the border to contraband -- whether marijuana or undocumented labor -- is not enough to end the internal black market, in our case, the employment of undocumented residents without work permits.  The prohibition on both new and existing migrant labor must be lifted to regain control over the border and bring order to the internal US labor market.  

EIA PSR Week of Jan. 20: Faltering consumption, continuing crude builds

  • The news this week centers on faltering refined product consumption (demand) and shockingly weak refinery runs

  • Consumption

    • Total product supplied and gasoline supplied were respectively 7% and  11% below normal (the same week in 2019) on a 4 wma basis

    • Moreover, both total product and gasoline supplied were also at lows not seen since early September

  • Refinery runs were down more than 16% on a 4 wma basis compared to normal (2019).  

  • Inventories

    • Despite weak consumption and an anemic level of runs, refined product inventories remained at typical levels, primarily due to exceptionally high product exports.  This is probably related to gasoline and diesel stocking in the EU prior to the implementation of the product import embargo starting on Feb. 5th.

    • Crude inventories builds have been tapering, still up a hefty 27 mb in the last month

    • The SPR was unchanged compared to last week

  • Low runs, faltering consumption and crude builds are sometimes associated with the beginning of an economic downturn

  • Meanwhile, C+C (i.e., oil) production remains stuck at 12.2 mbpd, materially unchanged since April

  • Finally, oil prices remain in soft contango to mid-year before reverting to typical backwardation levels in the second half of the year.

    • With the current contango, owners of physical oil have an incentive to store crude, and that is exactly what they have been doing in the US

  • If Russian refined product exports do not fall with the Feb 5th embargo, there is a downside case for oil prices, and a $10 / barrel sell-off is not out of the question.

Rigs and Spreads Jan. 20: Sizeable rig declines

Rigs counts were down

  • Total oil rig counts fell sharply, -10 to 613

  • Horizontal oil rig counts also fell, -6 to 559

  • Four of the six lost horizontal rigs were in ‘Other’, that is, not in major plays

  • The Permian horizontal oil rig count was down only 1

  • The pace of horizontal rig additions fell to -2.0 / week on a 4 wma basis, quite a poor performance considering recent oil prices

  • The calculated US breakeven to add horizontal oil rigs rose to $82 / barrel WTI versus $81 on the screen at writing.  

  • Frac spreads rose, +4 to 258, still no higher than in February nearly a year ago

  • The EIA published the January edition of the Drilling Productivity Report (DPR) this past week

    • In the current report, crude and condensate production from key shale plays rose to 9.04 mbpd in December, up 79 kbpd from November.  Total shale oil production growth has averaged 82 kbpd / month over the last three months

    • In the January report, the EIA revised up historical shale production quite sharply, on average by more than 130 kbpd in the Sept. 2021 to June 2022 time frame.   Current growth rates appear smaller as a result of base month upward revision.

    • Permian oil (C+C) production was up 38 kbpd in December.  Permian production growth has averaged 38 kbpd per month over the last three months

    • The DUC inventory bottomed in November and was up modestly in December.  We had anticipated the trough in September, but the correction was slower than expected

  • We continue to see a disconnect between DPR oil production numbers and those reported in the monthly STEO and the weekly PSR

    • The DPR suggests healthy production growth; the other reports suggest all but stagnation in output

Dec. Border Apprehensions: New CY Record

Customs and Border Protection reported December apprehensions for the US southwest border at 221,181, a new record for the month.  This bests the previous record, set by the Biden administration last year, by 50,000 and is three times the prior record of 71,000 set by the Clinton administration in 1999 and revisited by the Trump administration in 2020.  December apprehensions were also 60,000 above our forecast, the highest variance of the year, implying an upward trend in border apprehensions.

The numbers are simply surreal.  

With the December numbers now in, we can also present calendar year totals.  For calendar year 2022, border apprehensions reached 2,343,000.  This is 400,000 more than the previous record set last year by the Biden administration.  It is also 700,000 above the pre-Biden records of 1.6 million set by the Clinton administration in 2000 and the Reagan administration in 1986.

With December apprehensions exceeding expectations, we increase our calendar and fiscal year 2023 forecast for southwest border apprehensions to 2.7 million, which would represent a new record by 400,000 over fiscal and calendar year 2022.  These are truly mind-blowing numbers.  Annual southwest border apprehensions are beginning to approach 1% of the total US population.  

As before, inadmissibles -- those presenting themselves at official crossing points without appropriate documentation -- continue to soar, coming in at 30,306 for December.  This is twice the prior record, set in 2016 under the Obama administration.  As we earlier noted, the continued rise in inadmissibles suggests that Immigration and Customs Enforcement is materially waiving applicants through, presumably by guiding them to asylum procedures.  In earlier times, inadmissibles were not let into the country, hence the term 'inadmissible'.  The continuing, rapid and material rise in the inadmissibles count indicates that one can indeed enter the United States today at official crossing points without proper documentation.  

The numbers at the border have important lessons for both the left and right.

My libertarian friends at CATO and their academic counterparts at GMU have called for open borders.  For example, Bryan Caplan, professor of economics at GMU, has called for a border fee of $1,000 for entry to work in the US.  My earlier market analysis indicated that a $1,000 entry fee would be consistent with a potential market exceeding 1 billion migrants. 

The current pace of apprehensions show that the market is indeed vast.  Today's undeclared open borders policy can induce 3 million migrants to come north annually.   If migrants could enter legally for $1,000, arrivals could easily jump to 5 million per year, and perhaps twice that.  And they will keep coming until they are indifferent between staying at home and coming to the US.  Day laborers from Cameroon earning $0.50 / hour at home would be happy to come to the US and earn $3 / hour or be unemployed 70% of the time at current wages.   India, Bangladesh and Pakistan have hundreds of millions in the $0.50 / hour wage category.  And they would keep coming, faster than we could absorb them, until unskilled wages or unskilled employment fell so low that the journey was no longer worth it, when migrating to the US was no better, all things considered, than staying at home.  And staying at home in Cameroon or Bangladesh for an unskilled worker is a hard reality.  Open borders would import that reality into the US.  We can import the slums of Calcutta or the favelas of Rio de Janeiro.  There is precedent.  Government policy allowing in large numbers of poor immigrants created the banlieues of Paris and ghettos of Copenhagen.   That could, and would, happen here as well.  This is not a matter of ideology or bigotry, but rather straight-forward market analysis. For poor citizens of the poorest of countries, poverty as we think of it in the US can be a big step up from their daily lives at home.

From Professor Caplan's 2019 graphic policy book, Open Borders

The border situation also offers lessons for conservatives.

First, border enforcement is more about intent and will than physical barriers.  Apprehensions do not run at three times the previous historical record unless the president wants it that way.  We can see for ourselves that a wall is meaningless if the administration refuses to enforce the border.  For conservatives, therefore, any solution must work under both Republican and Democratic administrations.  It must be durable under changing political conditions, and that means the interests of both the right and the left must be served by any solution to achieve consistently acceptable results.

Second, an insistence on absolute sovereignty — a southwest border sealed against migrant labor — will prove a disaster.   After four years of Trump's vitriol against the Central American migrants, the US is seeing a tsunami of illegal immigration.  If conservatives want to play an all-or-nothing game, well, right now you are getting nothing.  

Third, we ended marijuana smuggling over the border without a wall or draconian enforcement.  We do not need a wall or draconian enforcement to end illegal immigration. 

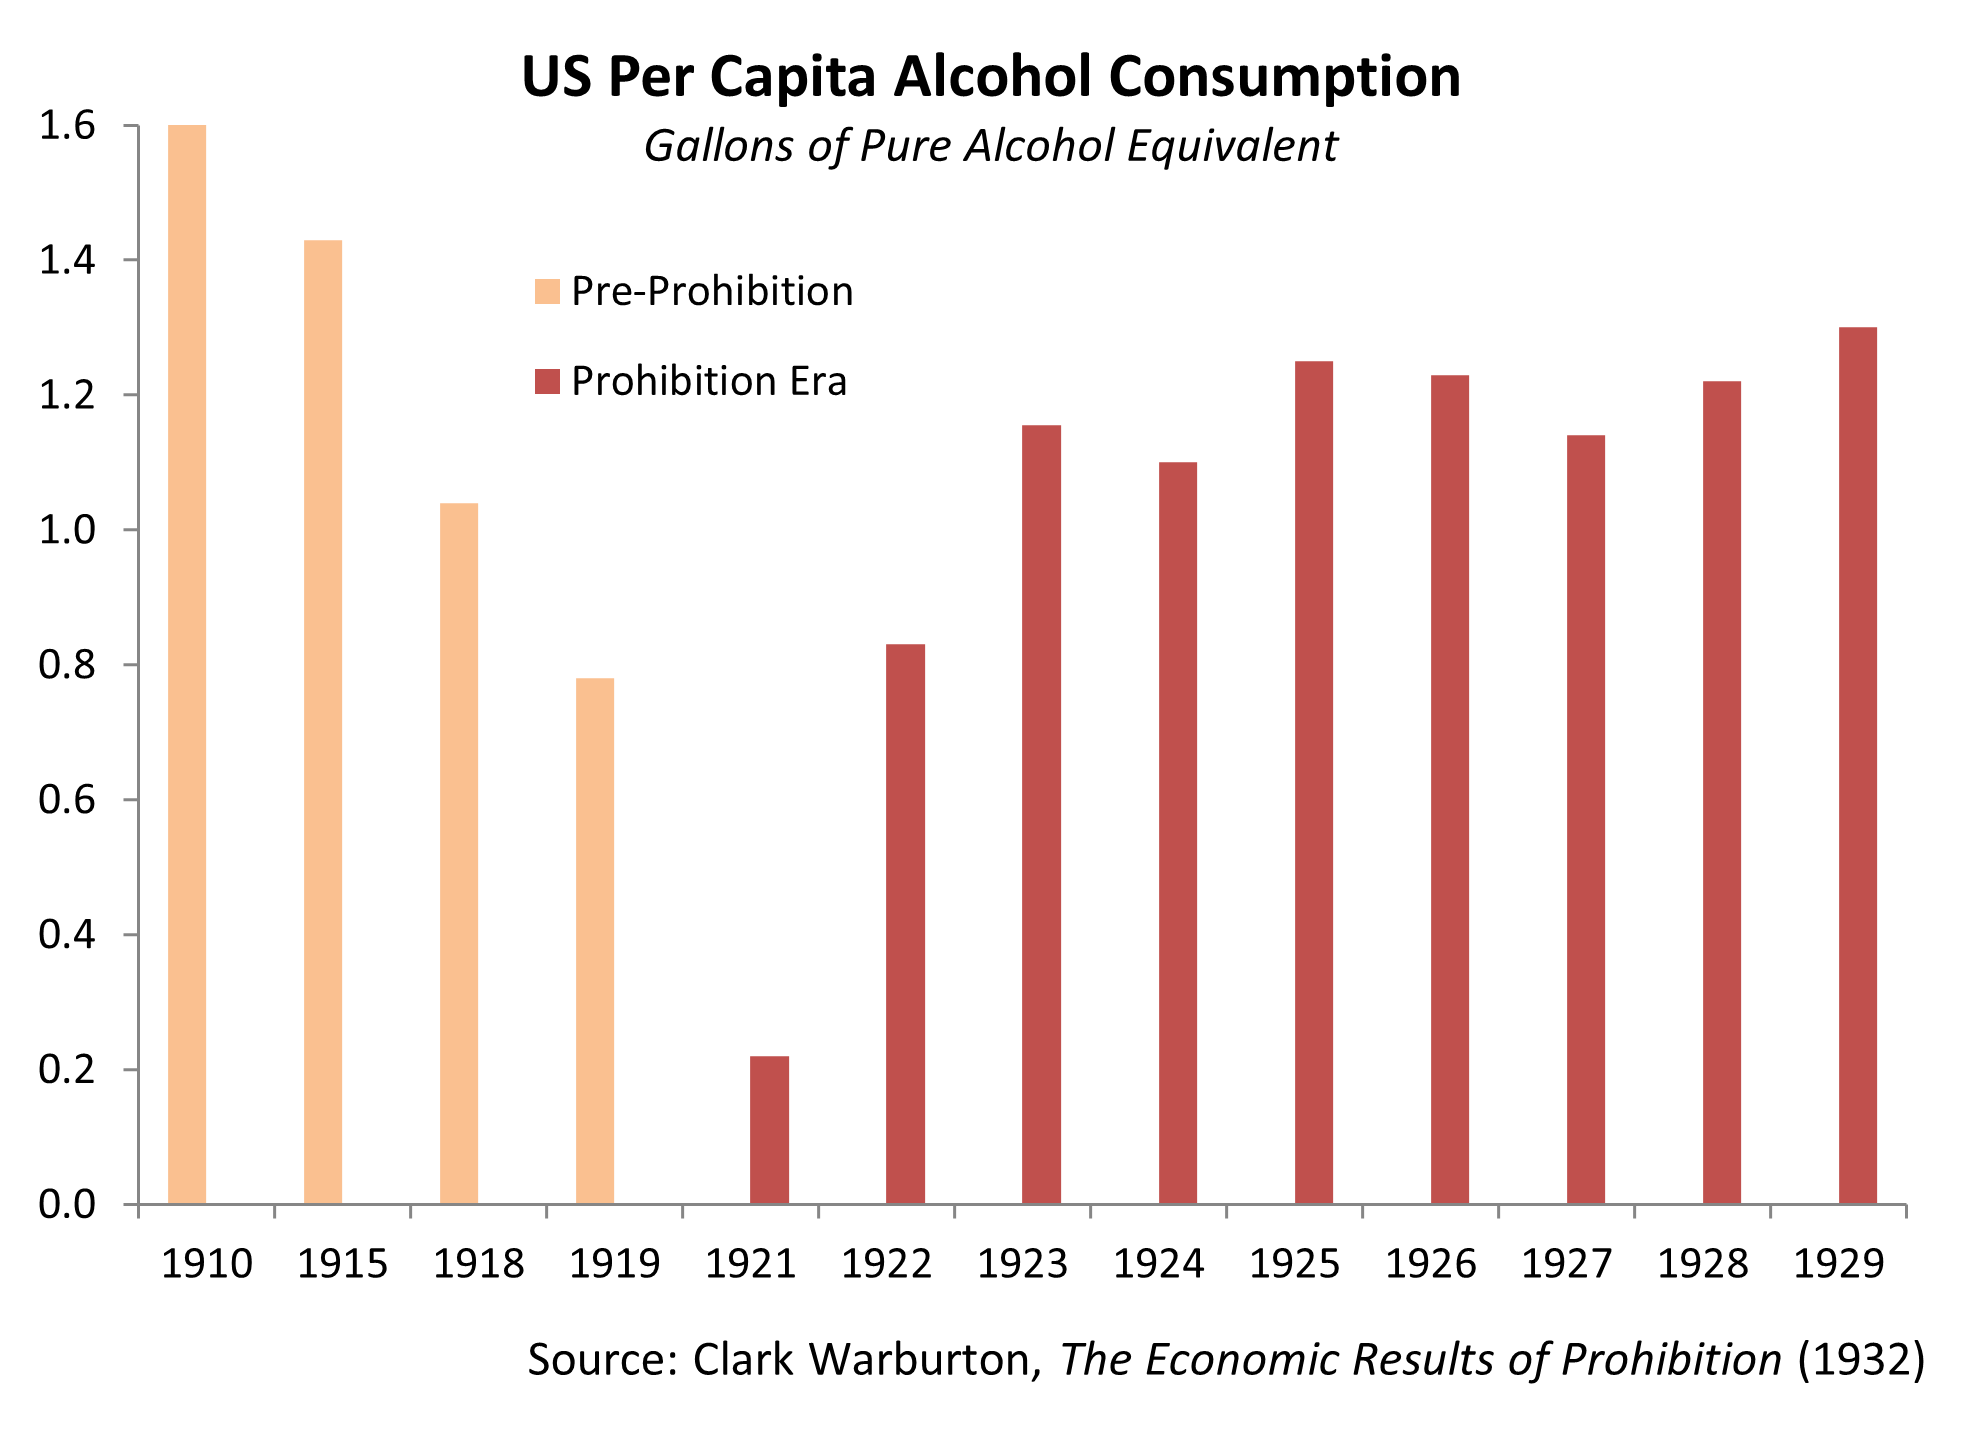
A legalize-and-tax system will work, as it has for marijuana and earlier alcohol.  Will it be perfect?  No.  Alcohol, for example, still causes material damage to the US economy. The CDC estimated the cost of excessive alcohol use in the United States at $249 billion in 2010, and binge drinking was linked to 140,000 premature deaths.  With all this carnage, do we intend to reinstate Prohibition?  No, and for good reason. The costs of Prohibition were much higher than the costs of dealing with legal alcohol.  For the black markets I have examined, the costs -- including corruption, violence, gangs, enforcement, and incarceration -- were 10-20x greater than the underlying problem. 

So it will be with a legalize-and-tax system for migrant labor.  Can such an approach deliver absolute sovereignty?  It cannot. But it can deliver safety, legality, propriety and appropriate compensation to the government for the right to work in the US at a B+/A- level, which is both good enough and ten times better than the current state of affairs.

Open borders also holds lessons for the left. As I wrote almost two years ago, open borders would destroy the chances for the normalization of the status of the long-term undocumented, including those covered by proposed DACA and Dreamers legislation. So it has proved.

Leaving the southern border wide open is contemptuous of the American public, a complete dereliction of the president’s duty to protect and control our borders. Under the circumstances, the votes for normalization will be lacking, as they were in the last two years when the Democrats held both the White House and Congress. Moreover, this impasse could last fifty years.

One of the strange features of black markets is their tendency to persist, as has been the case with illegal immigration. Since the IRCA amnesty fiasco of 1986, Republicans and some Democrats have been loath to consider offering any such leniency again. Nevertheless, at least some Republicans were sympathetic to the cause of DACA and the Dreamers.

That’s finished. President Biden’s Open Borders policy has gutted confidence in the willingness of any Democrat in the future to enforce agreed border legislation. Prior Democratic presidents were sympathetic to migrants, but generally enforced the border. Clinton saw a surge in 1999, but suppressed it within months. Obama’s apprehensions numbers were actually better than Trump’s. By contrast, Biden’s complete abandonment of the border is something new and unprecedented, and it will color Republicans’ willingness to strike a deal with Democrats for the next half century. Lest this be taken as exaggeration, keep in mind that many of those entering the US illegally after 1986 are still waiting for normalization of status. That was nearly 40 years ago. As a practical matter, the undocumented are neither expelled nor accepted, but merely tolerated in the shadows. This is the political equilibrium, as dysfunctional as it is stable. It can easily persist for decades to come, just as it has since the 1980s.

For the pro-migrant, woke left, the only plausible path to normalization is a legalize-and-tax regime. Such a regime requires not only legalization at the border, but also in the US interior. Barring that, a legal entry system will be comingled with a black market interior, with poor results. California’s botched marijuana legalization serves as an example of failing to address the incumbent black market. As a result, the large majority of long-term undocumented residents must be provided legal status — a work permit — if a legalize-and-tax regime is to be successfully implemented. For those looking for status normalization of the long-term undocumented within the next ten years or more, a legalize-and-tax approach is the only hope, not because granting legal status is nice or compassionate, but because it is necessary to clean up the mess of the last fifty-eight years.

The current tsunami at the border has lessons for all ideologies. For libertarians, open borders has been demonstrated as the disaster which analysis said it would be. For conservatives, a wall is clearly not enough, and an all-or-nothing approach is proving to be a dead-end. For the woke left, advocacy of open borders has betrayed the long-term undocumented, whose hopes for legal status may have to wait for a very, very long time.

Despite all this, fixing the border is perhaps the lowest hanging fruit in the US policy universe. At the conceptual level, it is just about a no-brainer. The politics are of course challenging. Execution also matters, and neither the structuring nor implementation of a legalize-and-tax system are trivial. Nevertheless, we can achieve stunning success if we commit ourselves to the endeavour.

DOE Weekly Data Jan. 13th: Soaring crude inventories

The crude oil aspects of the data were most interesting this week.

  • C+C production is up very modestly, +0.1 to 12.2 mbpd, materially unchanged since April

  • Commercial crude inventories have soared since the start of the year, adding 30 mb in just the last two weeks.

  • The collapse of refining, the source of demand for crude, is the key factor.  Refining has been down 2.8 mbpd on average over the last three weeks.  With refinery output down, crude inventories accumulate, given that crude imports have remained range-bound

  • Our incentive to store analysis also suggests quite soft balances, that is, our analysis is showing an explicit incentive to build crude oil inventory, and that’s exactly what we are seeing in the data.  This incentive will be similar around the globe.

  • Draws from the Strategic Petroleum Reserve appear to have ended, with crude SPR inventory stabilizing around 370 mb versus a neutral value of 640 mb.  This may well prove a problem going forward.

  • Refined product demand remains range-bound, still off 2019 levels by 3-7%, off by 11% in the case of jet fuel.